- Search Forex Factory
- Parallel trend-line system - still need help!Started Oct 13, 2013|Trading Systems|6 replies
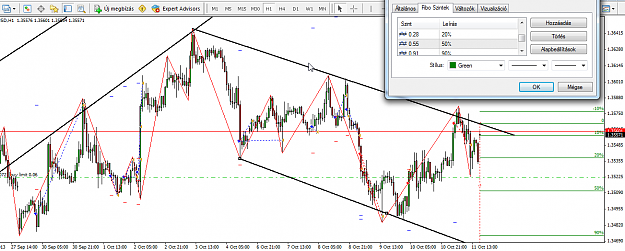
Welcome everyone who got excited by the thread! Here we go let me introduce my strategy: AperyonFX ...
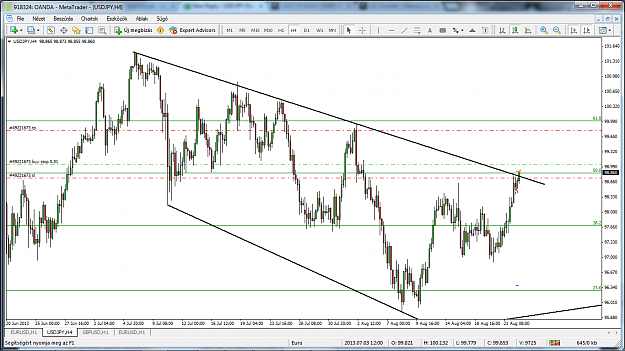
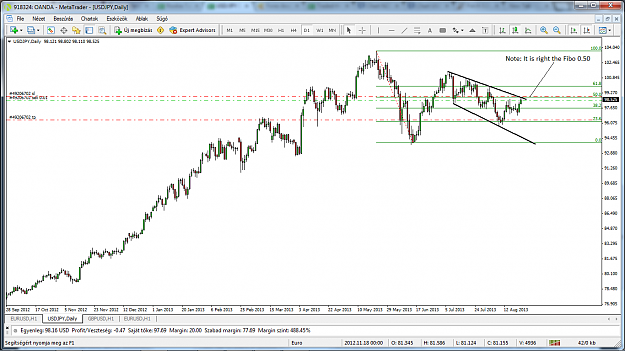
Welcome everyone who got excited by the thread! Here we go let me introduce my strategy: AperyonFX ...