- Search Forex Factory
- 15 Results
-
 MetBo replied Aug 30, 2018
Just a question regarding your MTS. MTS means Midterm stops, so at least more than three days old, I guess how it can be that a MTS is placed within the range of last days? for eg GJ image
The only thread you will ever need: FX Exposed!
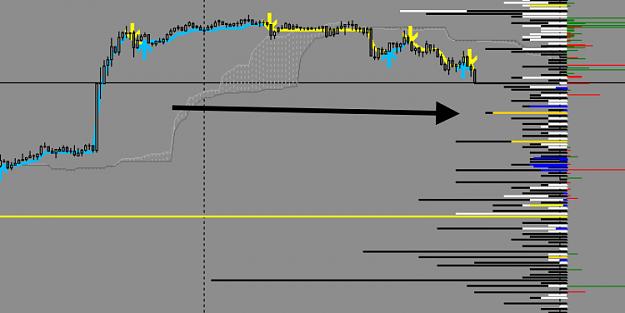

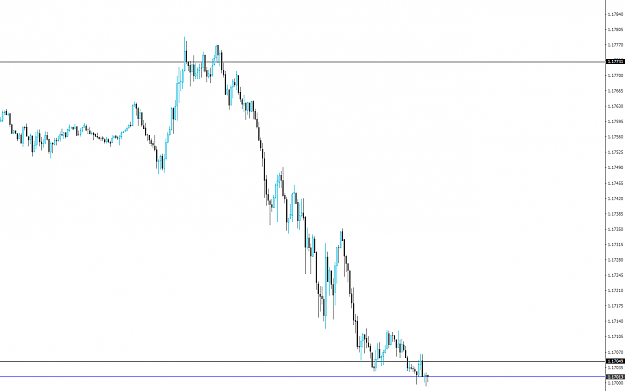
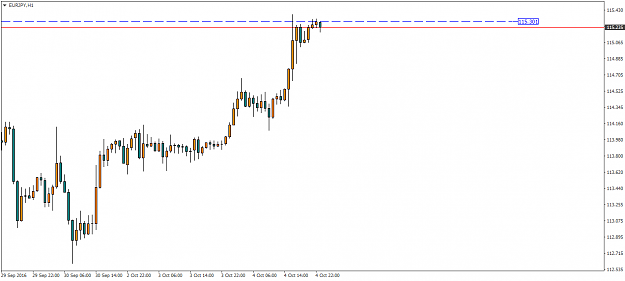
- MetBo replied Jun 6, 2018
Nice stop-run in EU...... the shorts of the past days are stopped out and I wouldn't be surprised when the price goes down now to catch the stops of the longs image
The only thread you will ever need: FX Exposed!
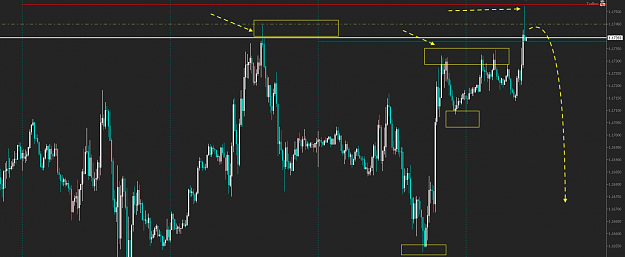
- MetBo replied Jun 5, 2018
...... continue ..... image
The only thread you will ever need: FX Exposed!
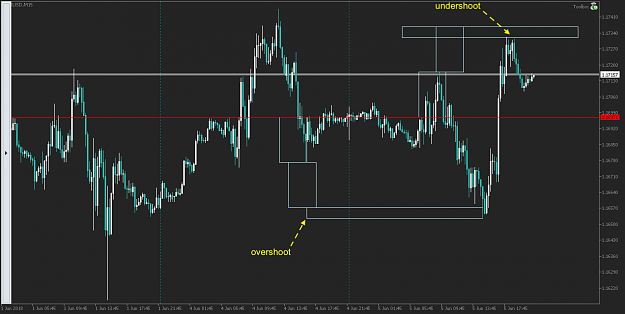
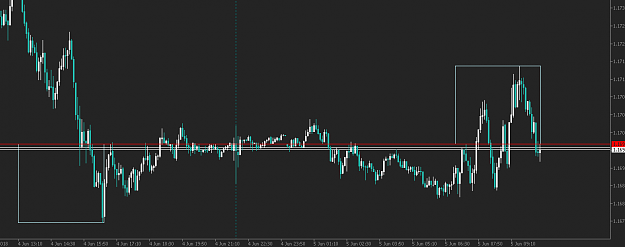
- MetBo replied Jun 5, 2018
I really don't know if you're talking about pattern like this, but I've found various pattern which give you very good entry points. I call them the 'symmetry of market'. image
The only thread you will ever need: FX Exposed!
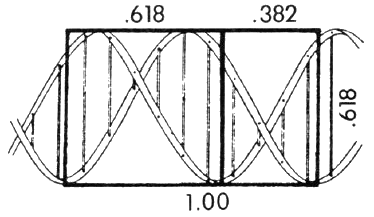
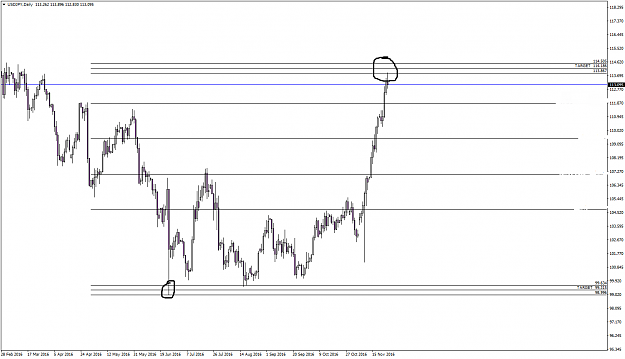
- MetBo replied Mar 30, 2018
i think you're talking about golden ratios image image
You do not know how to trade
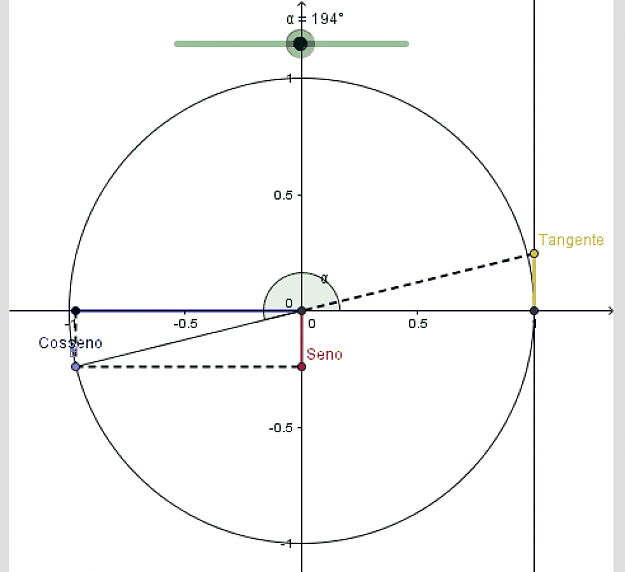
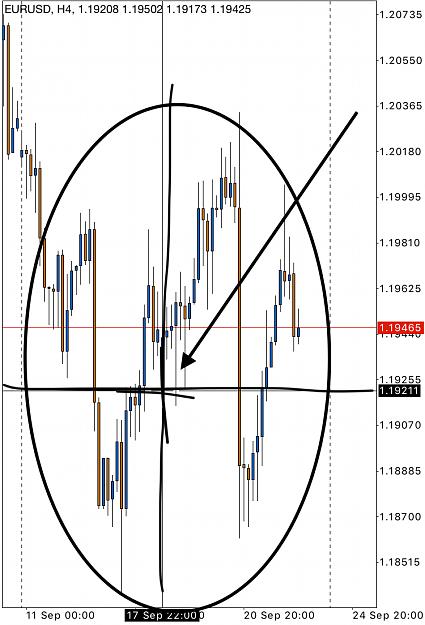
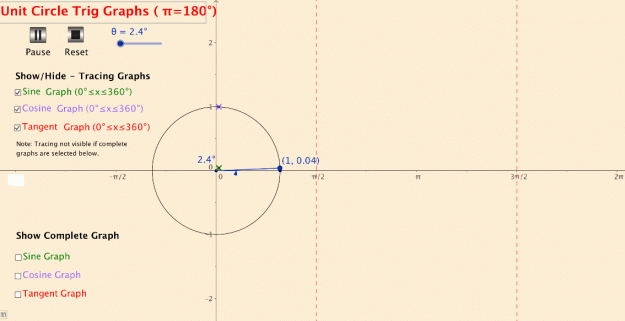
- MetBo replied Mar 25, 2018
Very good stuff !!! I use the trigonometry function to calculate the fix point / centrum of universe in my system. Price meets time. image
You do not know how to trade

- MetBo replied Feb 18, 2018
I hope you can read it: I'm running my mt5 on a vps server image It's not the best vps server, but this one was good enough for MT4 currently on my EUR profile I'm running 9 charts image but I've also these profiles: image they are organized ...
My MT5 Corner


- MetBo replied Feb 18, 2018
thank you for u'r reply. Yes, I've more than 500 synthetic symbols, but they are all disabled because atm they are not in use. I've build a bridge for the cryptocurrency market. My bridge is loading all OHLC data from binance into MT5 - so that I ...
My MT5 Corner
- MetBo replied Dec 13, 2017
nope, I dont mean the opposite. Well have a look on the following pictures image image OHLC is a frame for ticks, because OHLC collects all ticks within a specific time range (frame). Ticks are the only truth, they have information about price ...
Timing is everything but time is worthless


- MetBo replied Oct 5, 2017
Yes, but it’s depending on what the tick did yesterday. Every day we get two levels, one for buyer and one for seller. Usually the tick hits both levels, but sometimes there are more buyer or more seller in market or they have not enough power to ...
Higher Edge within a Single Candlestick
- MetBo replied Sep 22, 2017
Well you just need the crosshair to see what I am talking about. image sorry 4 my bad paint skills.
Higher Edge within a Single Candlestick Use the left side of an unit cycle to predict the current Candle.
- MetBo replied Sep 22, 2017
Basically I think the edge within a single candlestick is to understand that it is working like math, but you can't apply math on it. image
Higher Edge within a Single Candlestick
- MetBo replied Nov 28, 2016
Well, I use different OHLC data, but I like your clean trading system. image so, your approach is to avoid ranges and keep focus on "real price movements"?
OHLC Strategy
- Posts by Member Search: 'MetBo'