- Search Forex Factory
- 3,134 Results (1 Thread , 3,133 Replies )
-
 KeenPips replied May 5, 2024
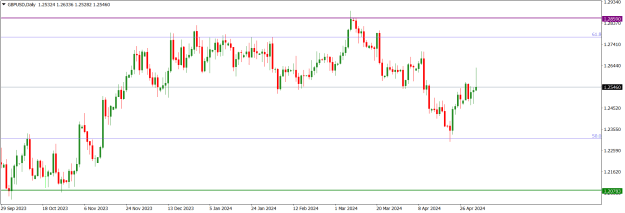
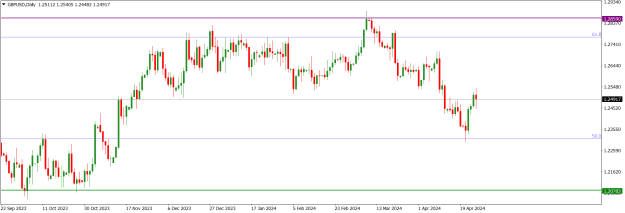
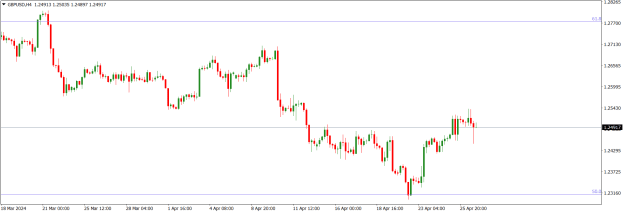
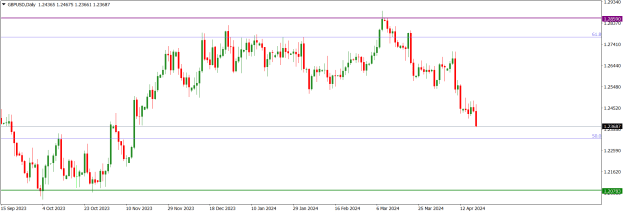
GBPUSD price action on the daily time frame issued a relatively long, ‘upper wick’ pin bar on Friday. This may result in a bullish retest of intra-day market imbalance or value area before a southward rotation. The dominant technical structure is ...
Cable Update (GBPUSD)
- KeenPips replied May 5, 2024
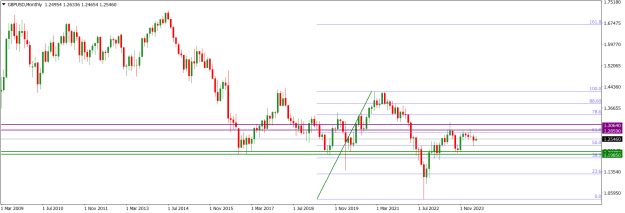
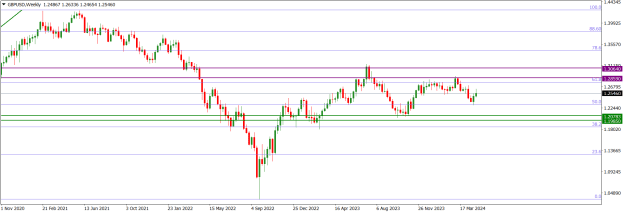
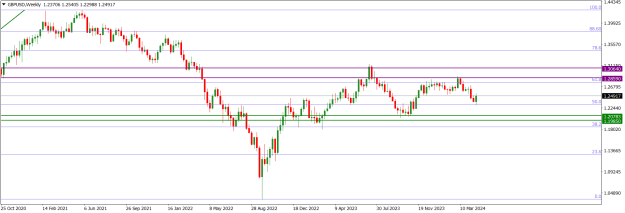
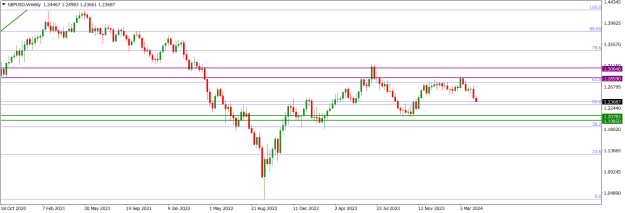
GBPUSD Weekly Technical Outlook GBPUSD market operation on the monthly time frame printed a doji-like or miniature candlestick in April. This printing was just above the 50-fib retracement area of the bearish swing that began in June 2021. image ...
Weekly Top-Down Technical Analyses

- KeenPips replied May 5, 2024
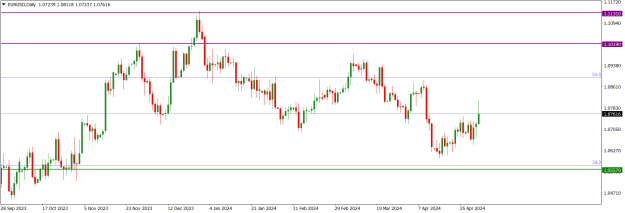
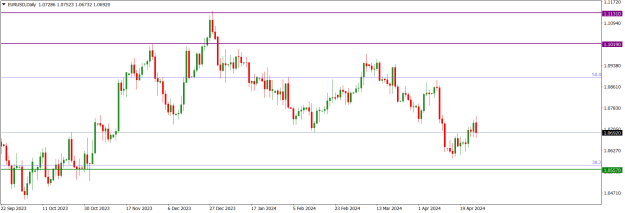
EURUSD price action on the daily time frame assumed a bullish mode in the latter part of last week after some sideways. Presently, the technical impulse favours bulls, but any northward move will be corrective in nature. This would give way to a ...
EURUSD

- KeenPips replied May 5, 2024
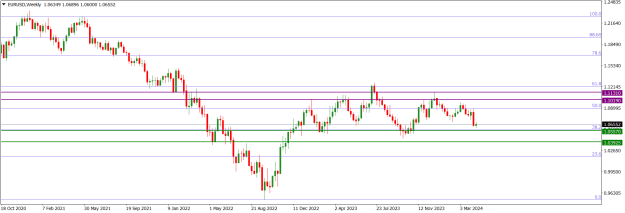
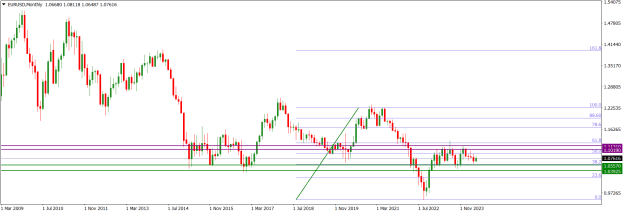
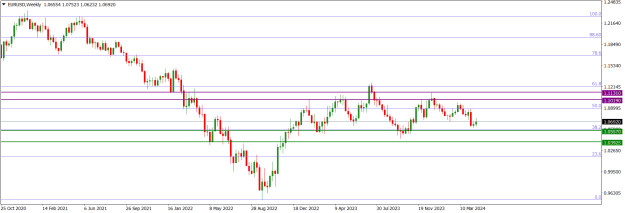
EURUSD Weekly Technical Outlook EURUSD market operation on the monthly time frame printed a miniature bearish candlestick in April. This printing was just above the 38.2-fib retracement area of the bearish swing that began in June 2021. image ...
Weekly Top-Down Technical Analyses
- KeenPips replied May 5, 2024
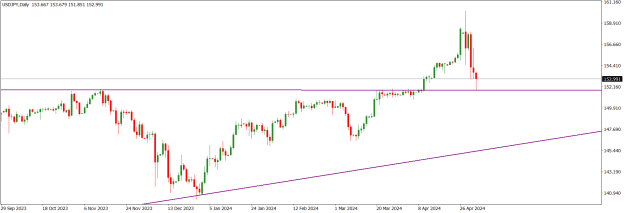
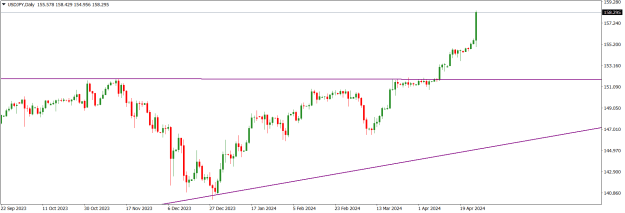
USDJPY price action on the daily time frame took on a bearish mode for much of last week. However, the bearish momentum decreased as bulls resisted a breakdown of the 151.900 area, which was a long-term horizontal resistance until turned support on ...
USD/JPY Discussion

- KeenPips replied May 5, 2024
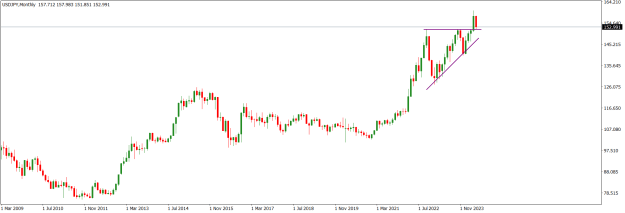
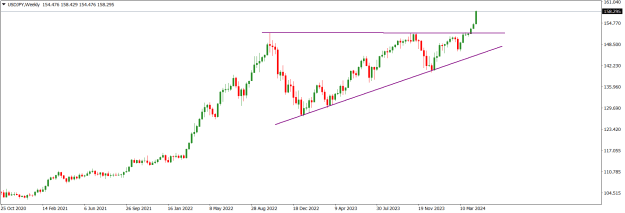
USDJPY Weekly Technical Outlook USDJPY market operation printed a bullish candlestick in April to create an all-time high of 160.216. The bullish drive in April was a breakout from the 151.900 horizontal resistance area that had been in place since ...
Weekly Top-Down Technical Analyses
- KeenPips replied May 5, 2024
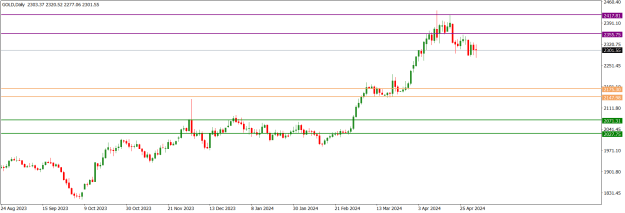
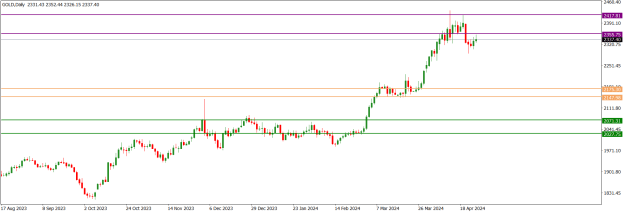
XAUUSD price action on the daily time frame turned sideways after a bearish breakdown of the 2355.75 horizontal support area. Presently, it is tackling the 2301.55 horizontal support area. Last Friday, price action printed an indecision candlestick ...
XAU/USD & XAG/USD - Gold & Silver Traders Thread

- KeenPips replied May 5, 2024
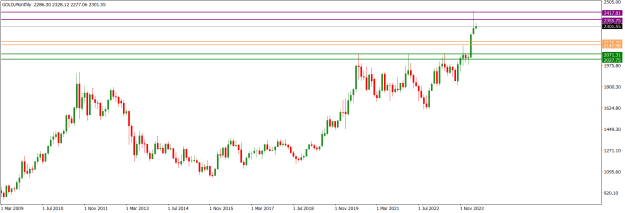
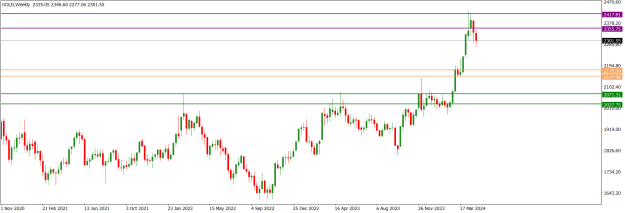
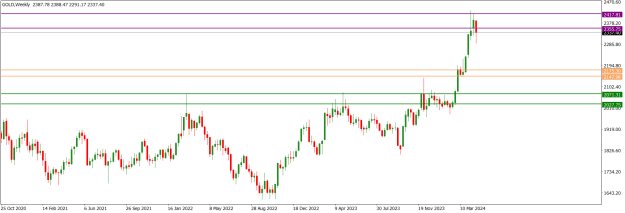
XAUUSD Weekly Technical Outlook XAUUSD market operation printed a bullish candlestick with a relatively long, upper-wick in April, technically a bearish pinbar, to print an all-time high at the 2431.40 area. This indicates that we would see a ...
Weekly Top-Down Technical Analyses
- KeenPips replied Apr 28, 2024
GBPUSD price action on the daily time frame is making a correction of a long-term bearish swing. Presently, price action is sideways at the 1.24910 horizontal resistance. But the technical impulse favours bears more than bulls. I may be wrong. Trade ...
Cable Update (GBPUSD)
- KeenPips replied Apr 28, 2024
GBPUSD Weekly Technical Outlook GBPUSD market operation on the weekly time frame has turned sideways at the 50 Fib area of a long-term bearish swing. Seven weeks ago, there was a bearish rejection of the bullish retest of the 61.8 Fib area. Although ...
Weekly Top-Down Technical Analyses

- KeenPips replied Apr 28, 2024
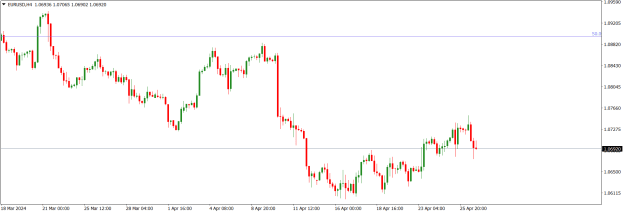
EURUSD price action on the daily time frame went sideways after a bullish correction of the bearish technical impulse. Presently, price action is located at the 1.06920 intra-day horizontal support and is a few pips above the 38.2 Fib area of a ...
EURUSD
- KeenPips replied Apr 28, 2024
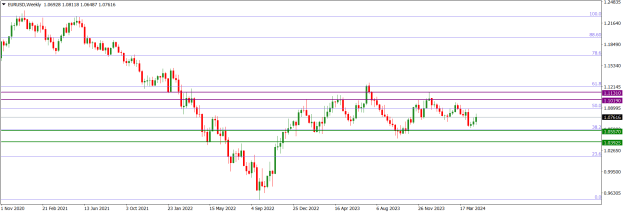
EURUSD Weekly Technical Outlook EURUSD market operation remains sideways near the 38.2 Fib area of a long-term bearish swing after a bearish drop from the 50 Fib area three weeks ago. The 1.05570 immediate horizontal support is in confluence with ...
Weekly Top-Down Technical Analyses

- KeenPips replied Apr 28, 2024
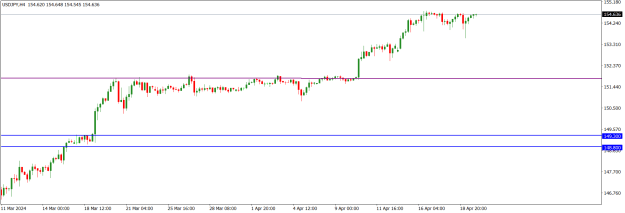
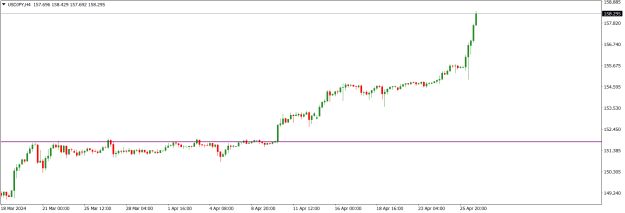
USDJPY price action on the H4 time frame made a northward drive to print an all-time high time at the 158.300 area. This was after a long period of sluggish momentum and consolidation. We should not be surprised to see bearish challenge of further ...
USD/JPY Discussion

- KeenPips replied Apr 28, 2024
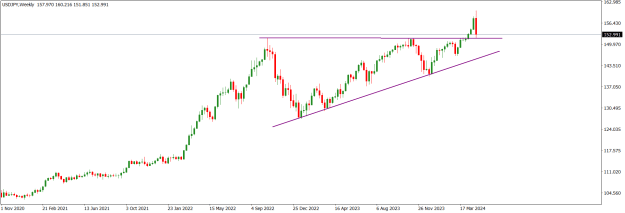
USDJPY Weekly Technical Outlook USDJPY market operation on the weekly time frame is bullish. Last week, the market operation printed a relatively big bullish continuation candlestick that resulted in an all-time high of 158.300. image USDJPY price ...
Weekly Top-Down Technical Analyses
- KeenPips replied Apr 28, 2024
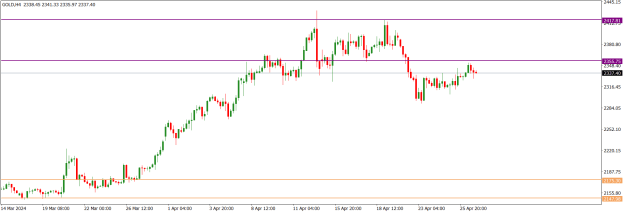
Although XAUUSD price action on the H4 time frame is presently sideways, price action was in a bullish correction of a relatively strong bearish drive. Technically, we may see further southward move in the early part of this week. I may be wrong. ...
XAU/USD & XAG/USD - Gold & Silver Traders Thread

- KeenPips replied Apr 28, 2024
XAUUSD Weekly Technical Outlook Last week, XAUUSD market operation on the weekly time frame made a bearish rejection of the 2355.75/2417.81 horizontal resistance zone (purple). However, the bearish candlestick printed has a long tail, which ...
Weekly Top-Down Technical Analyses
- KeenPips replied Apr 21, 2024
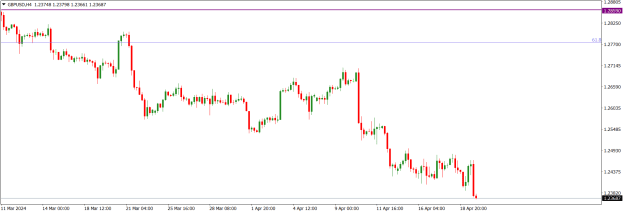
GBPUSD price action on the daily time frame is bearish. Presently, price action is tackling the 1.236887 horizontal support area. The dominant technical structure is bearish. I may be wrong. Trade safe and prosper. KP image
Cable Update (GBPUSD)

- KeenPips replied Apr 21, 2024
GBPUSD Weekly Technical Outlook GBPUSD market operation on the weekly time frame is bearish. However, there is a decline in bearish momentum. Last week, market operation printed a relatively smaller bearish candlestick than the one printed in the ...
Weekly Top-Down Technical Analyses
- KeenPips replied Apr 21, 2024
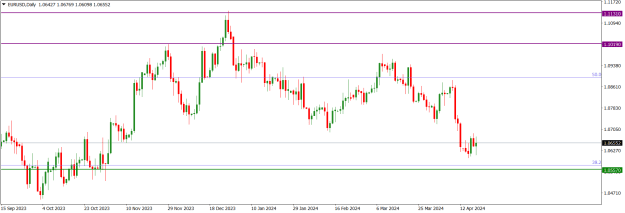
EURUSD price action on the daily time frame is in a bullish corrective mode. There was a bearish breakdown of the 1.07085 horizontal support arear a few days ago but price action went sideways thereafter before a brief bullish pullback. Technically, ...
EURUSD
- KeenPips replied Apr 21, 2024
EURUSD Weekly Technical Outlook The EURUSD market operation on the weekly time frame turned sideways last week after the bearish breakout of the previous week. Market operation is approaching the 1.05570 horizontal support area. image EURUSD price ...
Weekly Top-Down Technical Analyses