- Search Forex Factory
- 97 Results
-
 Fibonacci.bd replied Dec 16, 2022
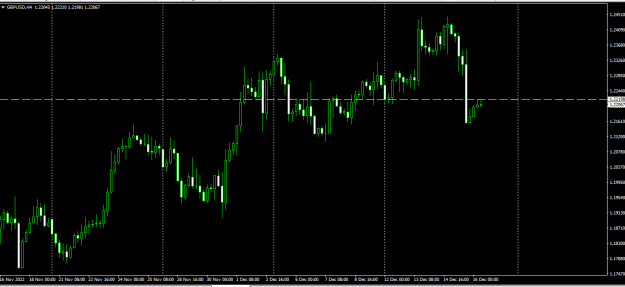
The pair made a strong bearish move in the H4 chart. It has been in bullish correction. A bearish reversal at the flipped resistance may drive the price towards the South.
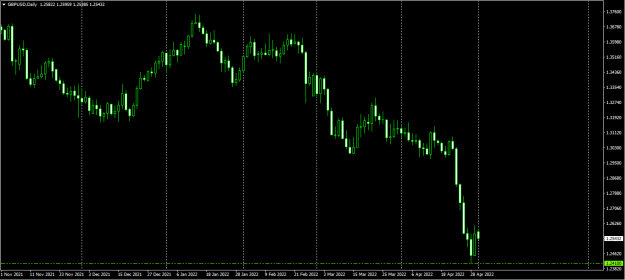
GBPUSD intraday trading
- Fibonacci.bd replied Dec 2, 2022
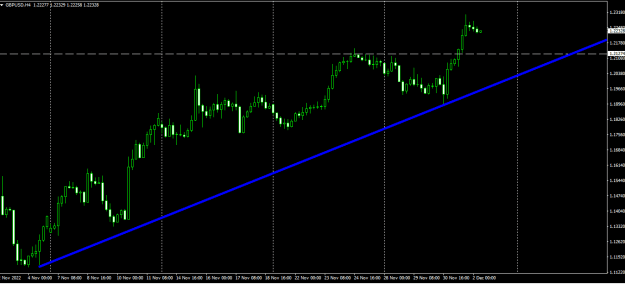
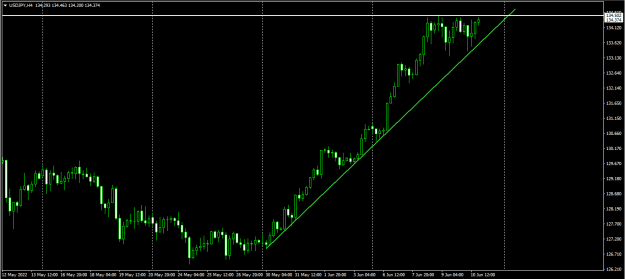
The pair has been bullish in the H4 chart. An up trending trend line is in play. If the price makes a bearish correction, the buyers may wait for the price to produce a bullish reversal pattern at the flipped support to go long in the pair.
GBPUSD intraday trading
- Fibonacci.bd replied Oct 31, 2022
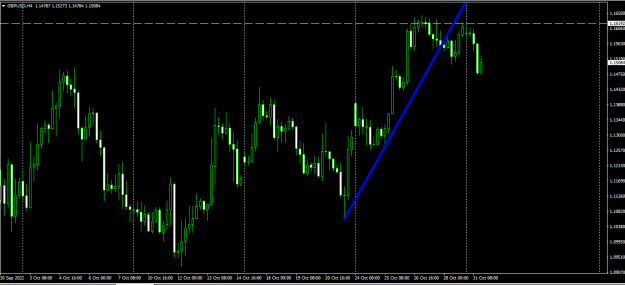
The H4 chart shows that the price made a breakout at an up trending trend line by producing a Double Top. It produced two consecutive bearish candles as well. As of writing, the price has been making a bullish correction. A bearish reversal candle ...
GBPUSD intraday trading
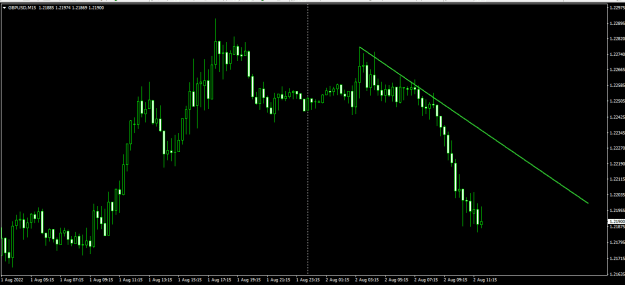
- Fibonacci.bd replied Aug 2, 2022
GBPUSD has been very bearish today in the intraday charts. The price has been obeying a down trending trend line. The sellers may wait for the price to consolidate and bearish breakout to go short. On the other hand, the buyers must wait for the ...
GBPUSD intraday trading
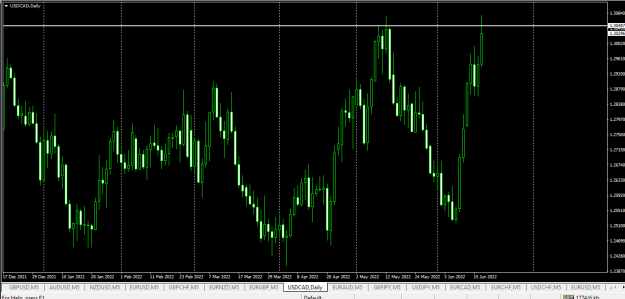
- Fibonacci.bd replied Jun 18, 2022
The pair has been very bullish in the daily chart. However, it closed its trading week right at the resistance, where it had a massive rejection. Traders are to be very watchful here. A bullish breakout above the level may push the price towards the ...
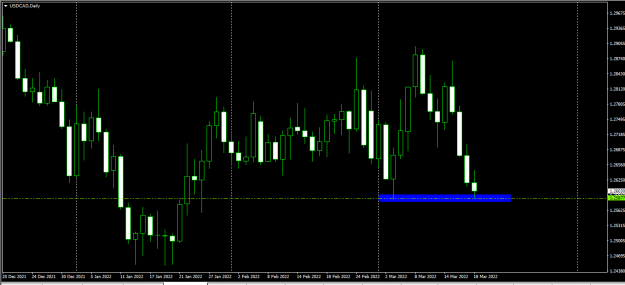
USD/CAD
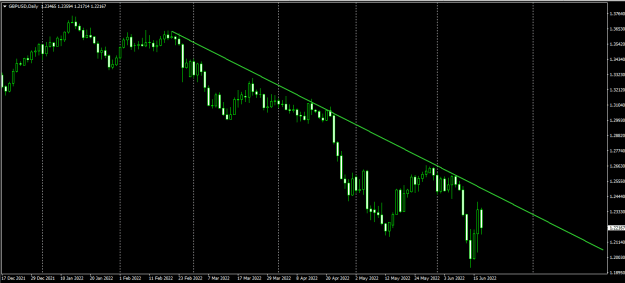
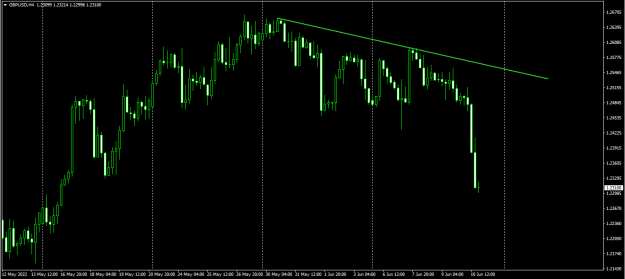
- Fibonacci.bd replied Jun 18, 2022
The pair has been in a bullish correction in the daily chart. The down trending trend line is still in play. The sellers may keep their eyes on the pair to go short from the resistance of that trend line.
GBPUSD intraday trading
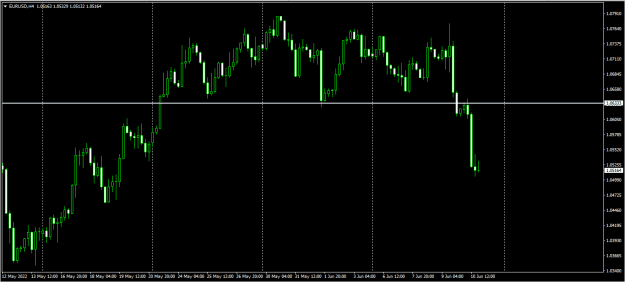
- Fibonacci.bd replied Jun 11, 2022
The pair produced tripple top and made a breakout at the neckline. The price has been heading towards the South with extreme bearish momentum. At the beginning of the next week, it may make some bullish correction. The sellers may wait for the price ...
EURUSD
- Fibonacci.bd replied Jun 11, 2022
The pair has been heading towards the North by obeying a trendline. The price consolidated around the trendline's support. A bullish breakout above the last resistance may push the price towards the North further.
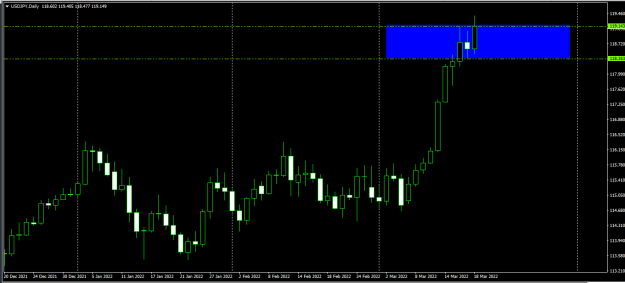
USD/JPY Discussion
- Fibonacci.bd replied Jun 11, 2022
The pair made a strong bearish breakout at the support. The bearish trendline is going to play a significant role to drive the price towards the South. I assume the Bear is going to dominate in the H4 chart. Thus, intraday traders may be able to ...
GBPUSD intraday trading
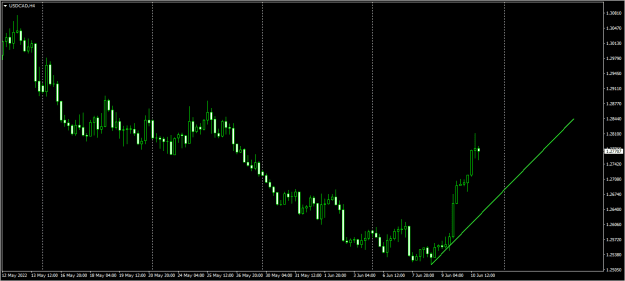
- Fibonacci.bd replied Jun 11, 2022
The pair made a significant bullish move in the H4 chart. Keep an eye on the trendline to go long in the pair. The level of 1.30500 is very much on the card for the buyers if the price finds its support at the trendline.
USD/CAD
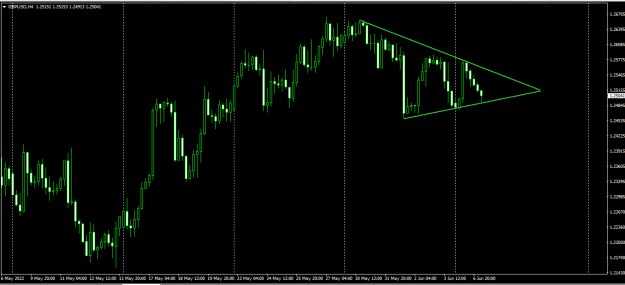
- Fibonacci.bd replied Jun 7, 2022
The H4 chart shows that the pair seems to be trapped within a triangle. The price had just one rejection and bounced twice. If the price ranges more within the triangle, traders may keep their eyes in the pair to make a breakout to find their ...
GBPUSD intraday trading
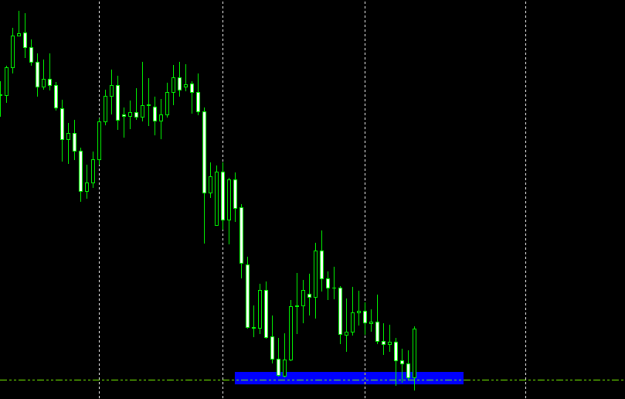
- Fibonacci.bd replied May 2, 2022
The pair has been bearish in the daily chart for quite a while. In some charts its oversold. So, the buyers may get ready to go long. However, they may have to wait for the price to produce a very strong bullish reversal pattern such as Double ...
GBPUSD intraday trading
- Fibonacci.bd replied Apr 13, 2022
GBPUSD is at a critical point. The pair is traded right at the level, where the price had a bounce and moved towards the North. The price has been very bullish so far today. Today's daily candle may close as a bullish candle. If that happens, then ...
GBPUSD intraday trading
- Fibonacci.bd replied Mar 20, 2022
The pair after being very bearish seems to have found its support at the level, where it had a bounce earlier. Since the momentum was very strong at the last move, thus the sellers may wait for the price to make a bearish breakout to go short in the ...
USD/CAD
- Fibonacci.bd replied Mar 20, 2022
The daily chart shows that the price has been heading towards the North with extreme bullish momentum. It produced a bearish corrective candle followed by a bullish Marubozu candle. Thus, the buyers may look to go long in the pair next week. I ...
USD/JPY Discussion
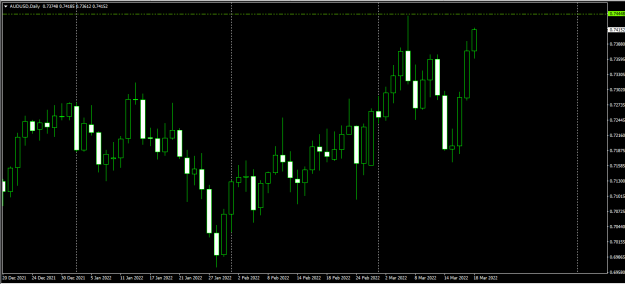
- Fibonacci.bd replied Mar 20, 2022
On the daily chart, AUDUSD looks very bullish. The price may soon find its resistance and consolidate for a while at the last swing high. The buyers may wait for the daily chart to produce a bullish engulfing candle closing above the last swing high ...
AUD/USD
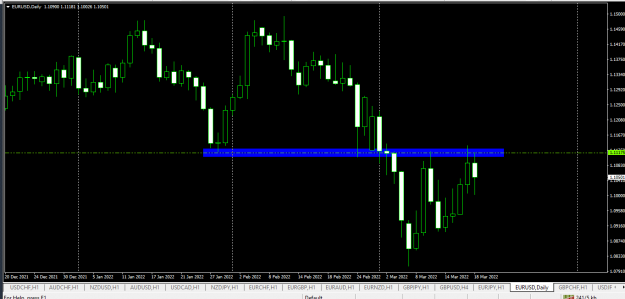
- Fibonacci.bd replied Mar 20, 2022
The daily chart shows that the pair had its second rejection at a flipped level of resistance. The sellers may look to go short in the charts such as the H4, H1 and 15M at the beginning of the next week. The price has enough space to travel towards ...
EURUSD
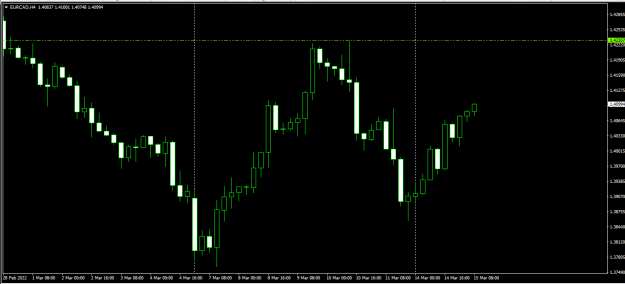
- Fibonacci.bd replied Mar 15, 2022
The price has been heading towards the North with good bullish momentum in the H4 chart. It may find its resistance around 1.42300. It is a significant level since the price had rejection twice in the H4 chart and made a good bearish move earlier. A ...
EUR/CAD
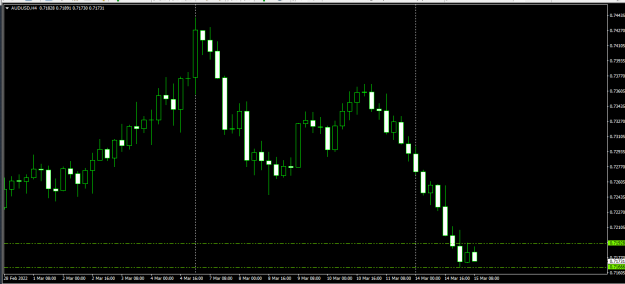
- Fibonacci.bd replied Mar 15, 2022
The H4 chart shows that the pair produced a bullish corrective candle. The current candle has been bearish as of writing. If it closes below the lower low, the sellers may go short in the pair and drive the price towards the South further. I assume ...
AUD/USD
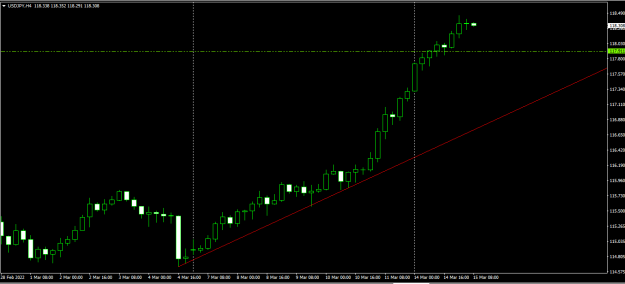
- Fibonacci.bd replied Mar 15, 2022
The pair has been extremely bullish in the H4 chart. We can draw an up trending trend line as well. I am waiting for the price to make some bearish correction followed by a bullish reversal to go long in the pair. The level of 117.910 may work as a ...
USD/JPY Discussion