- Search Forex Factory
- 35 Results
- jack411 replied Mar 29, 2019
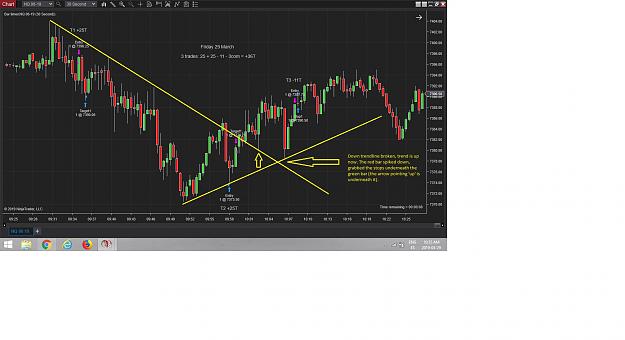
this is much easier said than done, after the fact. Take a look at the price action I've noted for your 3rd trade. Again, easier to see and explain in hindsight, but something to think about for the future... The trend had changed. You had just ...
Plan the Trade
- jack411 replied Mar 19, 2019
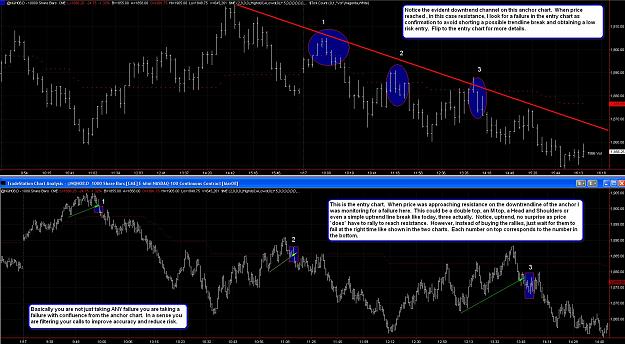
Price action is all you need. This is from a classic thread on ET> the AHG thread. These principles still work very well today... image
Plan the Trade
- jack411 replied Mar 18, 2019
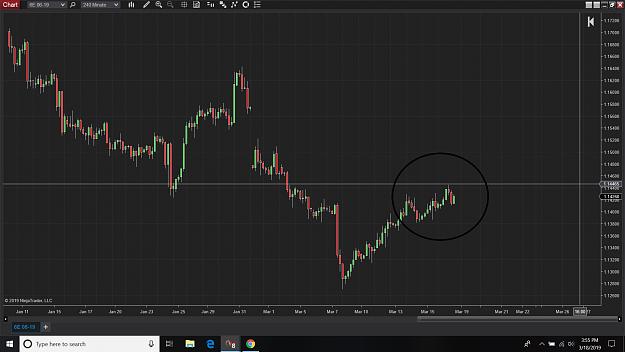
C What is your take on something like this? I see this as just a pullback in an uptrend on the 4hr chart. Reason being, is that there doesn't seem to be a defined supply level that caused price to reverse. So I think we will continue heading up. Of ...
C-12's Supply, Demand and PA thread
- jack411 replied Mar 18, 2019
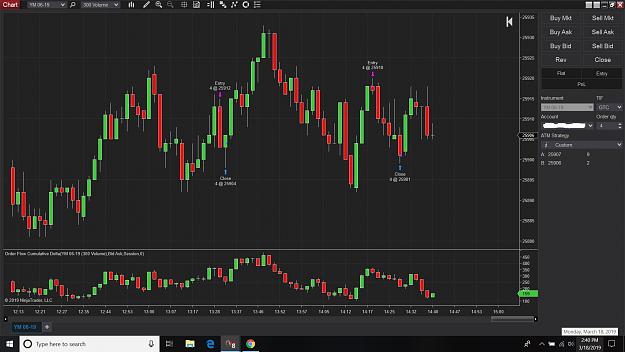
I'm leaning towards price dropping but dont plan on trading the rest of the day... image
Plan the Trade
- jack411 replied Mar 17, 2019
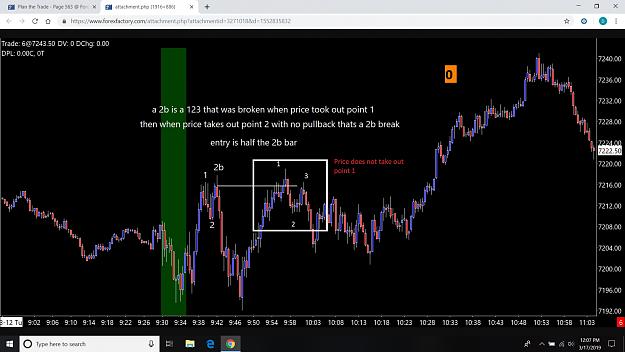
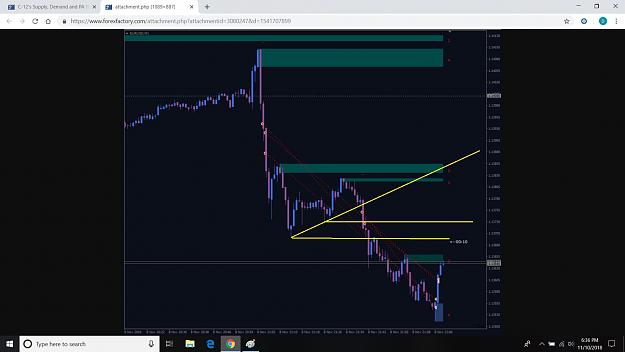
But then there's also a 2b (in yellow) within that 123 I annotated, that happened first.... image
Plan the Trade

- jack411 replied Mar 17, 2019
and just to show you the difference, with the same chart, I marked the 123 right next to the 2b Divergence annotated. image
Plan the Trade
- jack411 replied Mar 13, 2019
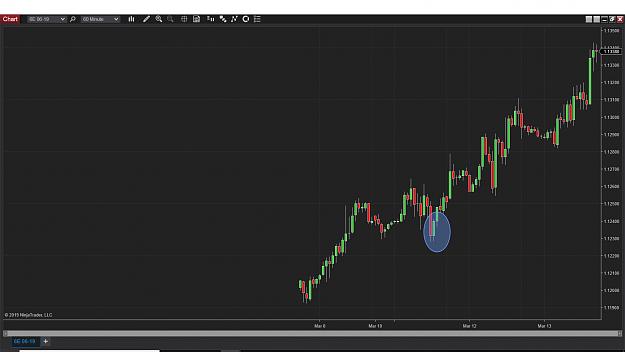
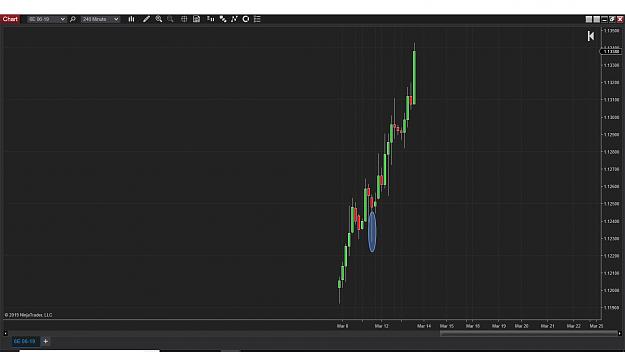
Heres what Ive got for 60min and 4hr. The circled area are your first longs. So on the 4hr, there is a red hammer bar with the tail that indicated buying. That was forming on the 4hr while you entered on the 30min correct? Do you consider that 4hr ...
C-12's Supply, Demand and PA thread
- jack411 replied Feb 26, 2019
image Trend down and TP hit with short trade.
High Level Accuracy Method With Little To NO Draw-down
- jack411 replied Jan 31, 2019
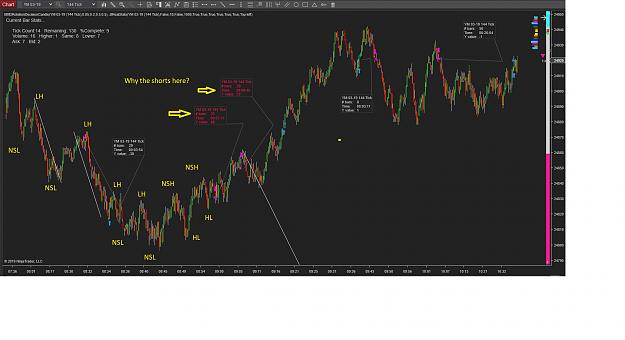
I marked up the chart with what I think are new structure highs/lows, etc. I'm wondering why you took the shorts where you did? I want to know if you're seeing things differently than me and if so, how do you see it? thanks image
Ratios & Harmonics: a Different Way to Trade
- jack411 replied Jan 19, 2019
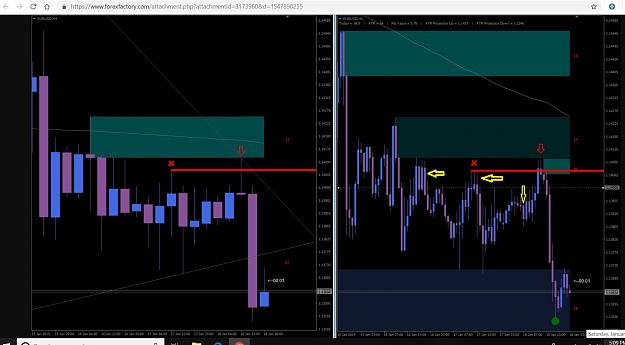
C What keeps you from taking the engulfing candles where I put the yellow arrows? Technically, the first two worked out quickly as they touched into the next demand level on the 1hr chart. The place where your arrow is marked was obviously the best ...
C-12's Supply, Demand and PA thread
- jack411 replied Jan 4, 2019
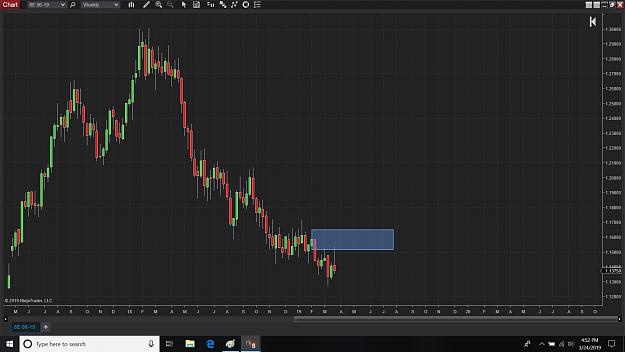
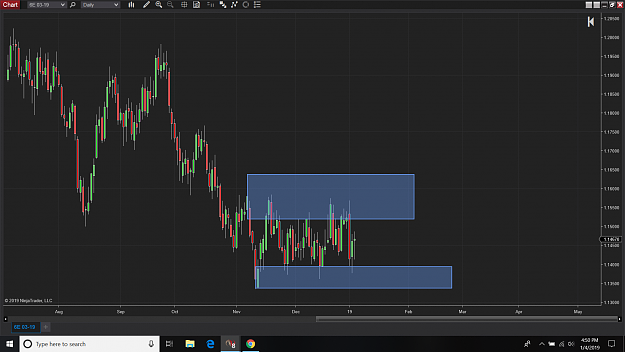
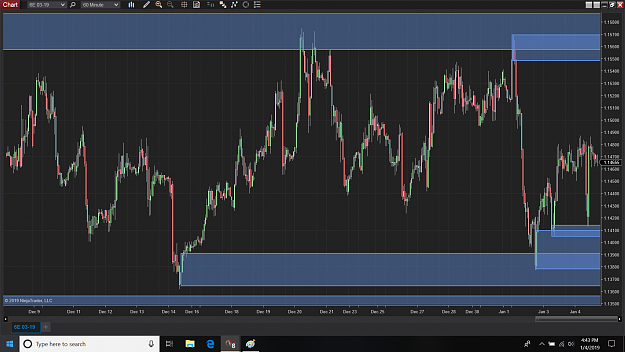
and here's the 6E daily range were in... image
C-12's Supply, Demand and PA thread
- jack411 replied Jan 4, 2019
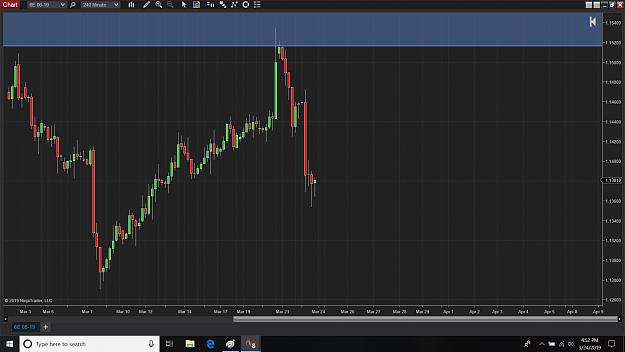
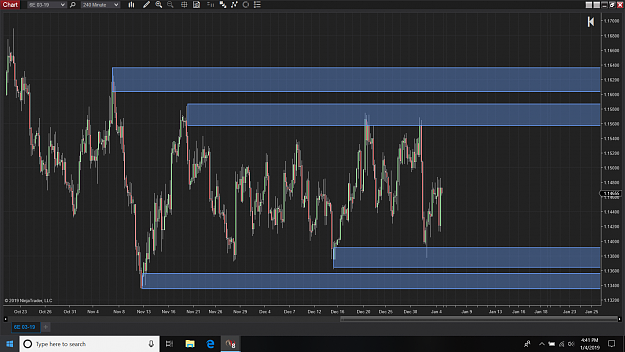
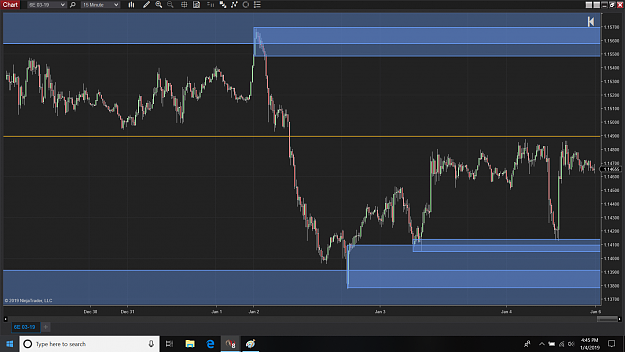
Here is the 6E at the moment on 4hr, 1hr, and 15 min.... I think we will head up to the 4hr supply level next week. My reasoning is because it looks like we've most recently hit a well-defined demand zone,the supply that's stopped us from going up ...
C-12's Supply, Demand and PA thread
- jack411 replied Nov 10, 2018
C, I see the engulfing entries, but do you also take into account trendline breaks on whatever your entry chart is, or is it just a coincidence? I marked a couple on your chart (yellow). I know these breaks happen anyway and is part of the nature of ...
C-12's Supply, Demand and PA thread
- jack411 replied Oct 5, 2018
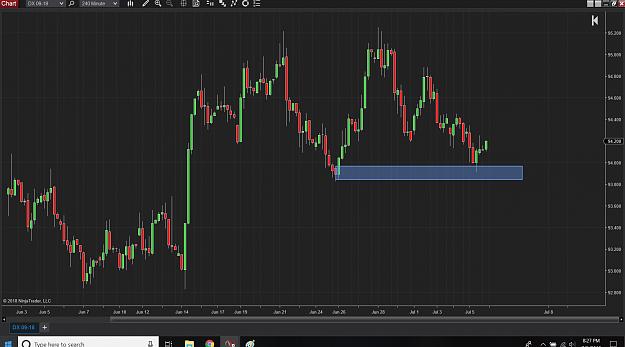
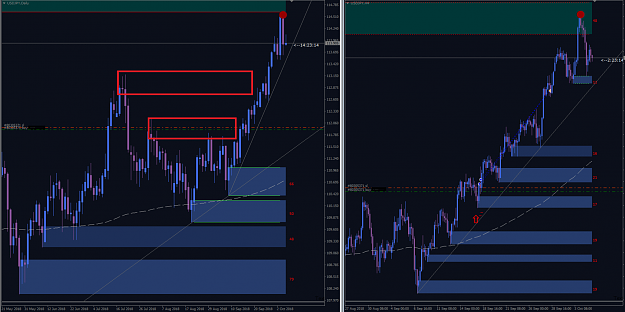
C, These aren't the best supply zones, but the red ones I marked on the daily - did you ignore these because the overall trend is up, and because the lower demand zones haven't been violated and new ones are still being created? I see the supply ...
C-12's Supply, Demand and PA thread
- jack411 replied Aug 3, 2018
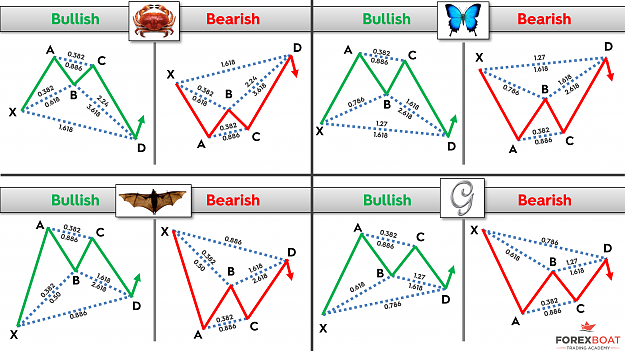
Nice trades sheep Do you or anyone know of a site or reference material where I can see the basic requirements for the ratios of each harmonic pattern? For example, Gartley = a retraice of _% followed by _% with a correction of _% My wording and ...
Ratios & Harmonics: a Different Way to Trade
- jack411 replied Jul 7, 2018
C, since the topic of s/r was brought up and since somebody pointed it out, what were your thoughts on those 2 positions you opened on the 5minute chart? It looks like you took 2 buy positions off the bounce of that yellow s/r line. I looked back, ...
C-12's Supply, Demand and PA thread
- jack411 replied Jul 5, 2018
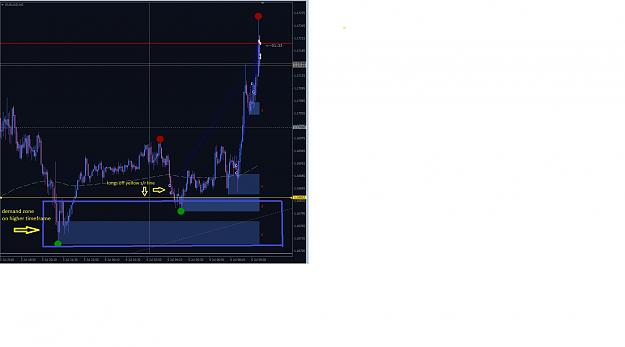
Here's an example of price pulling back and touching a 4hr demand zone as seen on the 1 min chart. There were no other clear cut demand zones on the 1 hour, 15min, or 5min unless I missed them - none that were touched I mean. Volatile market today, ...
C-12's Supply, Demand and PA thread
- jack411 replied Jul 5, 2018
Looks like we did get the bounce from the next demand level... C, have you ever found anything consistent when it comes to situations like this? Meaning, after a trendline is broken like this one was..Or is it just waiting to see the reaction once ...
C-12's Supply, Demand and PA thread