- Search Forex Factory
- 47 Results
- Skf replied Dec 16, 2020
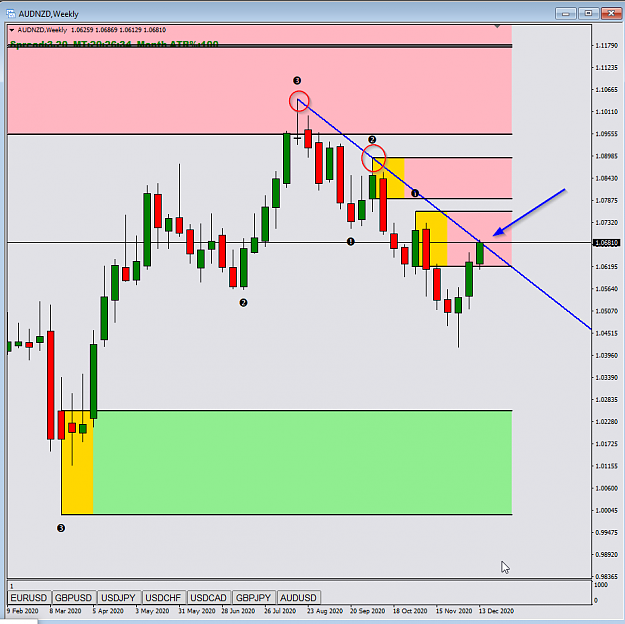
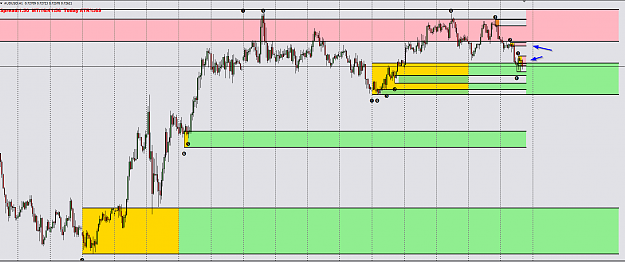
swingtrade65 - weekly is interesting as well too image
Trading Institutional Order Flow
- Skf replied Nov 24, 2020
Supply and Demand Dashboard image This dashboard shows you and alarms (if you want) when price enters the TimeFrame supply or demand zones. It is a grid of timeframes and will have a red or green square to show you what zone price is in. image ...
Trading Institutional Order Flow

- Skf replied Nov 24, 2020
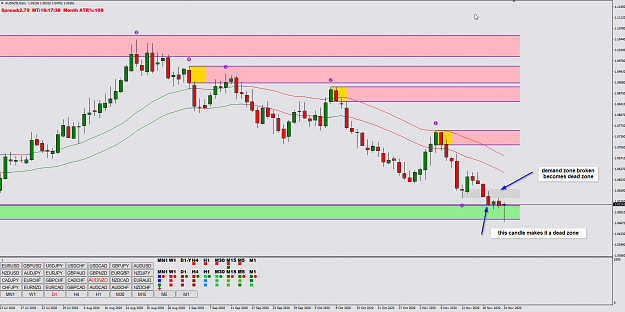
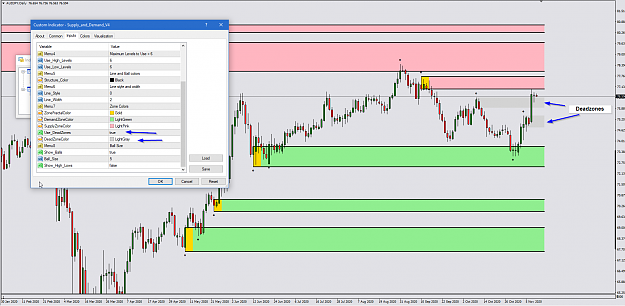
Deadzones are previous zones that have been broken, For example, in the chart below, we had a daily demand zone, but a daily candle closed below the zone, invalidating the zone making it "dead". However I like to see them for a while because a lot ...
Trading Institutional Order Flow
- Skf replied Nov 19, 2020
Chart looks same now - possibly the H1 may have been different as it can change by the hour? You can see because a few hours have gone by that our charts differ a little because the H1 timeframe zones progressed image
Trading Institutional Order Flow
- Skf replied Nov 17, 2020
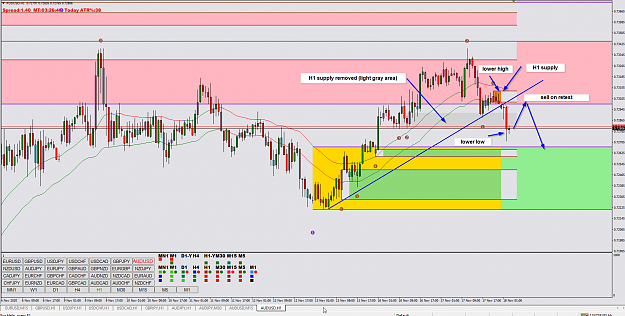
AUDUSD sell idea - Reasons: -H1 supply in Daily supply area -new low formed after lower high - h1 demand.support taken out - trendline break -head and shouders What do you all think? image
Trading Institutional Order Flow
- Skf replied Nov 11, 2020
Merka Merka- Latest version of this indicator is on post #9021. It is based on a Fractal (left candles, right candles) in a value in the parameters. However, after each "fractal" point is gathered it is used/unused depending on price path and ...
Trading Institutional Order Flow
- Skf replied Nov 10, 2020
Hi Barnell, Showing an early breakout attempt - press conference in 5 minutes.... image
Trading Institutional Order Flow
- Skf replied Nov 10, 2020
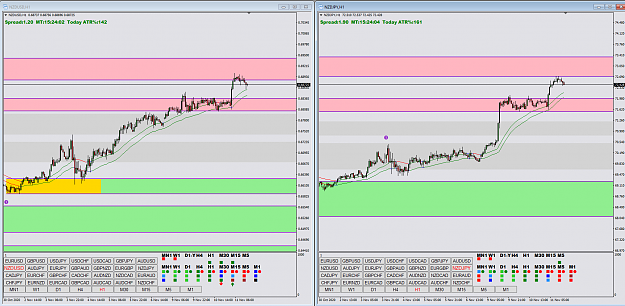
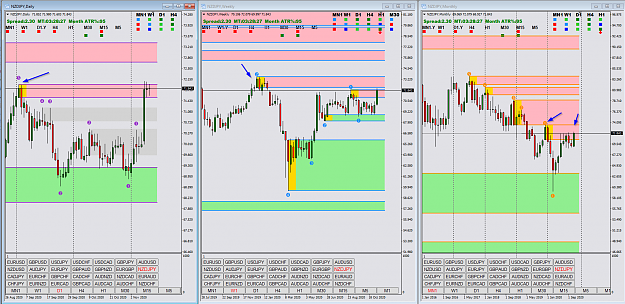
NZDJPY in all large timeframe supply zones.... image
Trading Institutional Order Flow
- Skf replied Nov 10, 2020
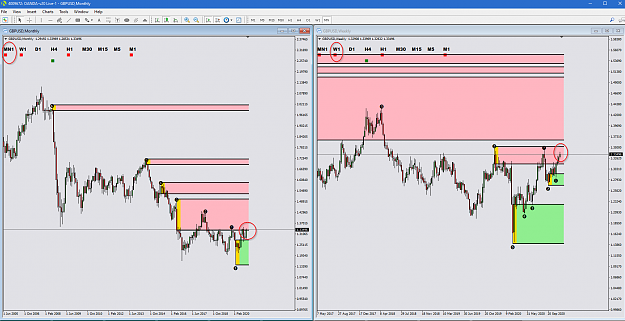
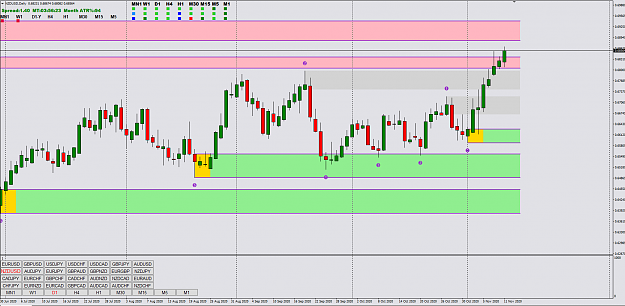
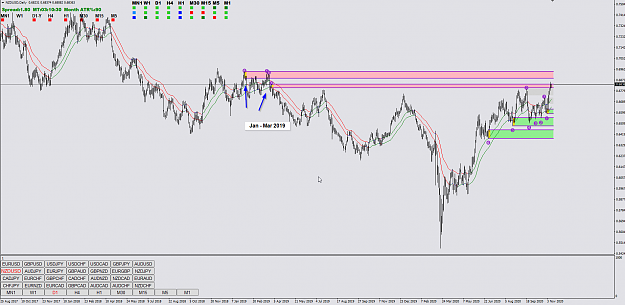
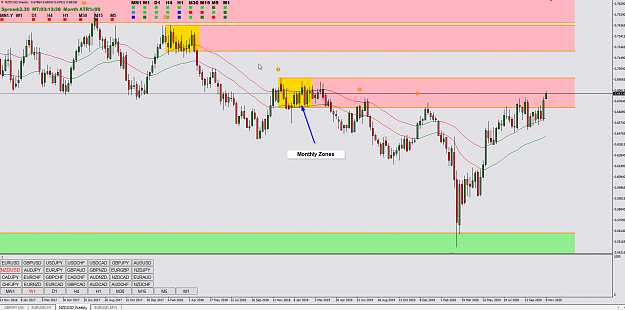
Keep an eye on NZDUSD - it is pushing on zones created Jan-Mar 2019 - we are hitting daily zones embedded into Monthly zone image Monthly zone image
Trading Institutional Order Flow
- Skf replied Nov 10, 2020
New Version Supply and Demand V4 I received a PM to add a "deadzone" feature, meaning keep the supply/demand zone around after price clears it. The deadzone will stay until the indicator creates new zones and resets. It is optional to use deadzones ...
Trading Institutional Order Flow
- Skf replied Nov 9, 2020
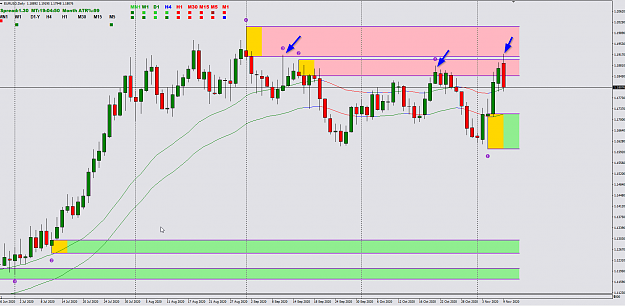
EURUSD having some nice reactions off the daily supply zones. I missed selling it today as I was thinking it may go higher into the top zone (at least into the wick more of the pinbar candle) ......always hard to tell! image
Trading Institutional Order Flow
- Skf replied Oct 30, 2020
Hi Gabrielnew, --Multiple indicators on 1 chart - You can put the indicator on a chart multiple times. Just give them a different Indicator_Number in the inputs. --MT5 version - I do not have mt5 and have not programmed in MT5 ever. Also, my broker ...
Trading Institutional Order Flow

- Skf replied Oct 28, 2020
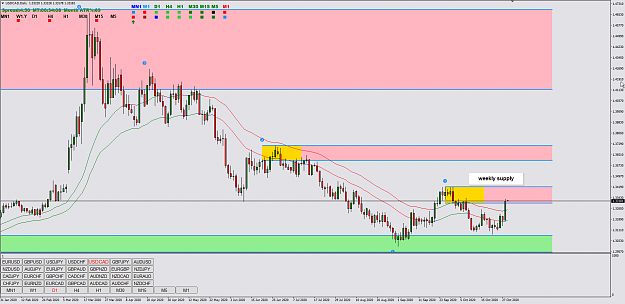
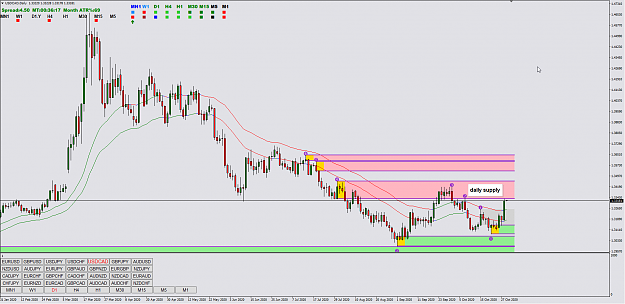
USDCAD continues up - is now bashing into weekly and daily supply - depending on election, oil and USD strength, we could be looking at a big move soon image image
Trading Institutional Order Flow
- Skf replied Oct 28, 2020
file vilem.iv, I think I got 2 out of the three requests. The fresh zone in tested zone is adjusted and the option to turn Balls off is also in. The "adjusted zone" due to price penetration is really complicated for the way I designed this. I ...
Trading Institutional Order Flow
- Skf replied Oct 28, 2020
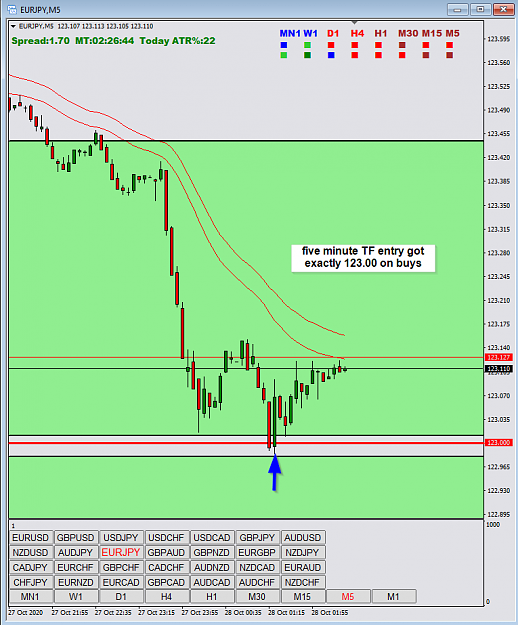
My eurjpy trade above didn't work so well! The small Asian session day trade paid for the stop loss just like I said! image
Trading Institutional Order Flow
- Skf replied Oct 27, 2020
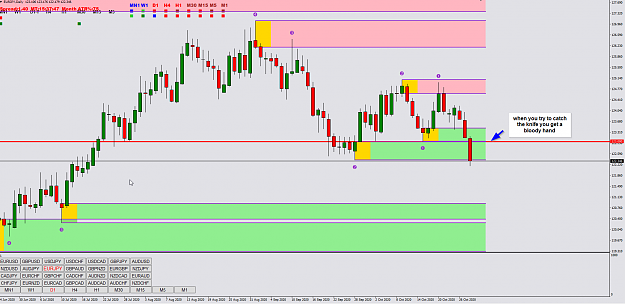
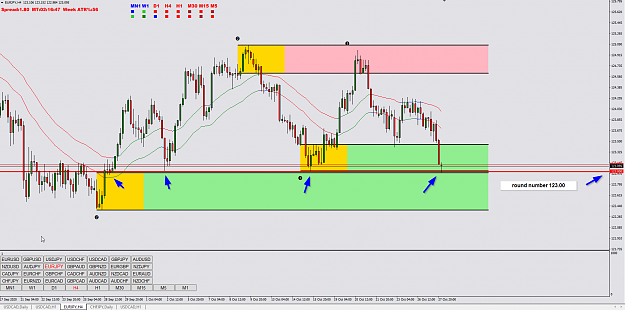
catching the knife....EURJPY long at 123.00 I opened two positions - one for a swing trade, the other for a small asian session trade (maybe to pay for my stop loss!) image image
Trading Institutional Order Flow
- Skf replied Oct 27, 2020
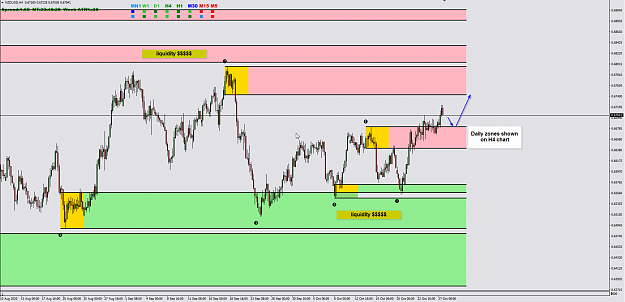
NZDUSD is holding and trying to breakout - pretty clear sailing up tp the next supply zone I'm hoping to see a pullback as shown image
Trading Institutional Order Flow
- Skf replied Oct 27, 2020
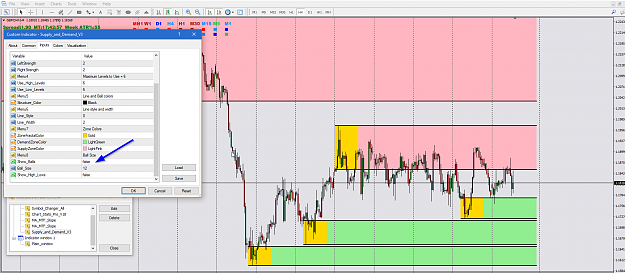
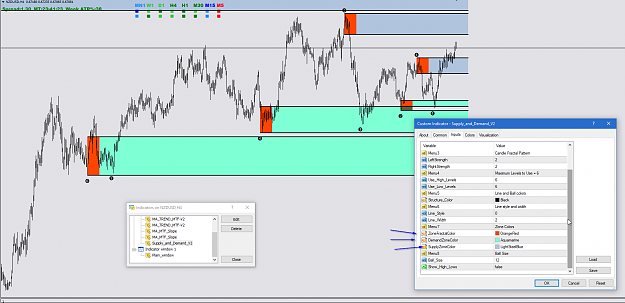
Hi vilem.iv, I have updated the indicator above in post 8982 so you can choose colors for the three zones. The gold fractal, lightgreen, and lightpink color can now be changed to whatever color you want. The default is the original colors.... image ...
Trading Institutional Order Flow
- Skf replied Oct 27, 2020
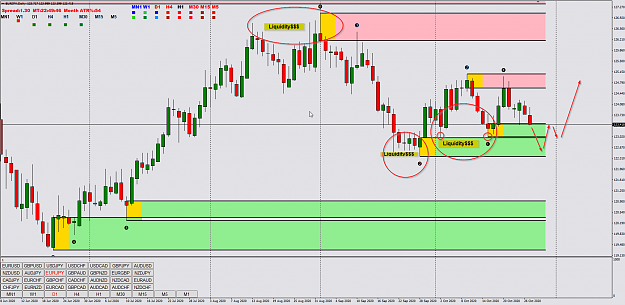
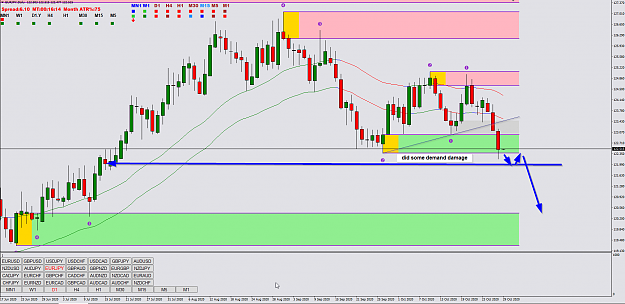
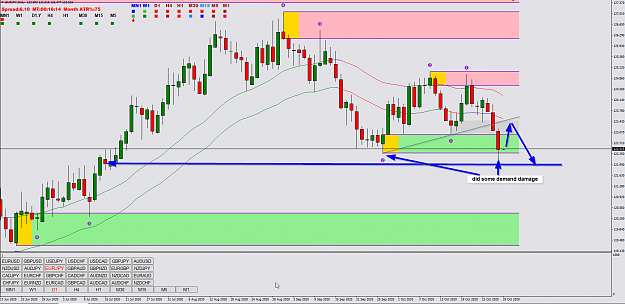
EURJPY idea. Double lows usually have stops (liquidity) under them. Looks like a stab down and back up could be possible. As marked on the chart, it happens over and over again on every time frame. I will be monitoring price action for this move ...
Trading Institutional Order Flow