- Search Forex Factory
- 82 Results (3 Threads , 79 Replies )
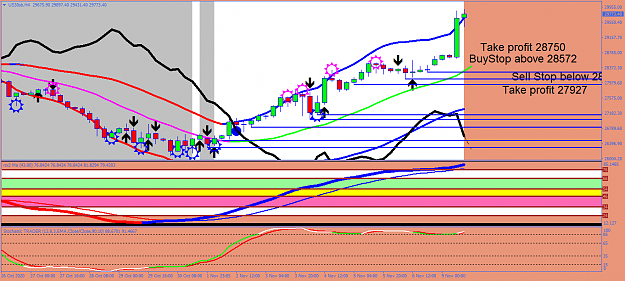
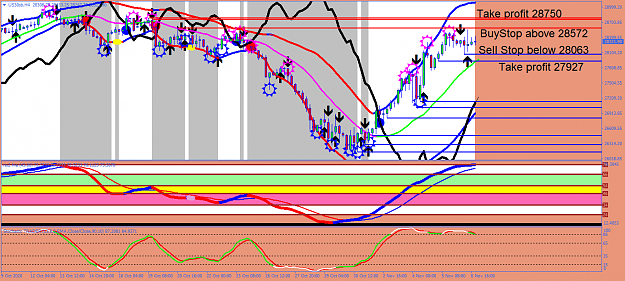
- 2george replied Jul 11, 2021
Interesting what this will do over the weekend. I have it in the early stages of sell divergence but with support at 34812 (sell below) and resistance at 34893 (buy above). Loved the piano recital - lucky you. George
Trade the Dow/Dax
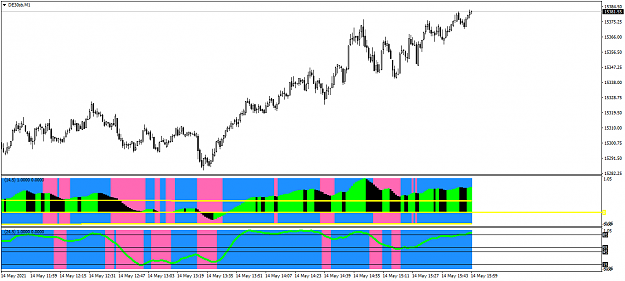
- 2george replied May 14, 2021
I made this specifically for the Dax 1m but it appears to transfer successfully to all other TF's as does the MAbufferhisto. Thanks - appreciate the thread and hope this helps. George
The "You can't be serious" system
- 2george replied Jan 11, 2021
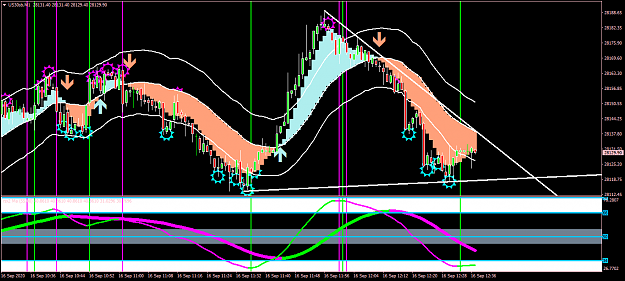
the template will cover normal candlesticks too - see chart for 1m US30. George
Easy Eyes Renko

- 2george replied Jan 11, 2021
If anyone feels they want to download please feel free but must do both the indicators and the template to acheive the illustration. Never 'refresh' the indicator as it will change but in live trading I feel it is hugely helpful with the Renko ea. ...
Easy Eyes Renko
- 2george replied Nov 9, 2020
Here is the result of what the EA would have produced - a PROFIT of 177 points. It went the other way to what I would normally have expected as there was sell divergence apparent on the Stochs indicator - this is the advantage of having an automatic ...
I will code your EAs and Indicators for no charge
- 2george replied Nov 8, 2020
Here is something I hope will be very different to think about when coding a new EA. Pending Market Orders, specifically Buy Stop and Sell Stop orders, instead of Market Execution Orders. What will this achieve that instant market orders cannot ...
I will code your EAs and Indicators for no charge
- 2george replied Sep 30, 2020
I know you don't use/like indicators but would it help if I posted this template and indicators? I feel that they would reduce if not eliminate uneccesary losses - but no one can eliminate losses entirely. George
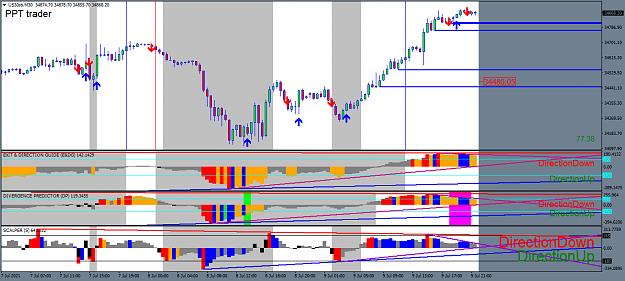
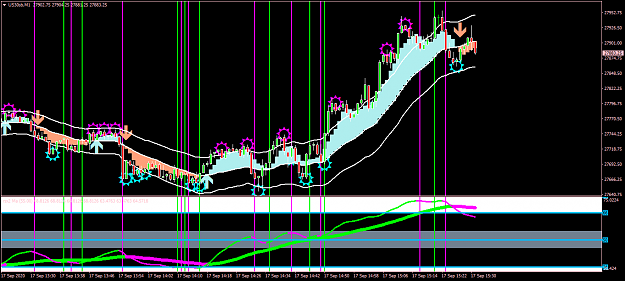
DOW Futures
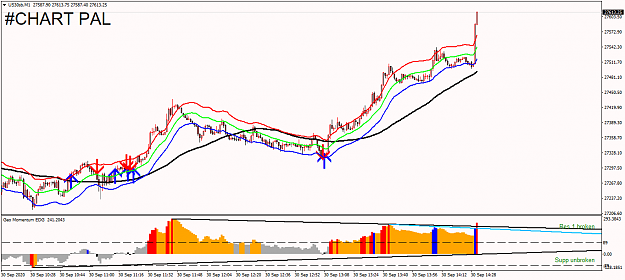
- 2george replied Sep 17, 2020
I only test indicators and templates - till I achieve the impossible. Some days are very easy to make good money and others you have to sit back and be patient. Today would have been easy as basically from 2pm to 3.30pm UK time the Dow was up. At ...
DOW Futures
- 2george replied Sep 16, 2020
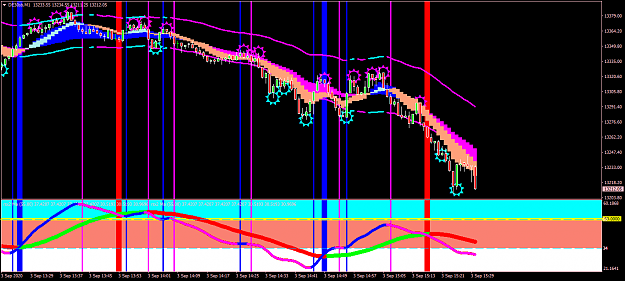
If I were trading, which I am not, I'd be waiting for a Dow long entry. George
DOW Futures
- 2george replied Sep 3, 2020
I'm with Rmg - even though I live in the UK. The FTSE is not a great profit producer. If I were to go back to live trading again (which I never will) it would be the Dax. George
DOW Futures
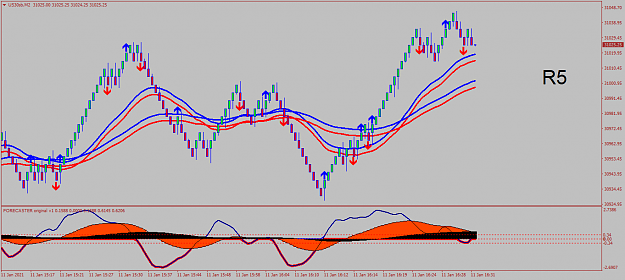
- 2george replied Feb 11, 2020
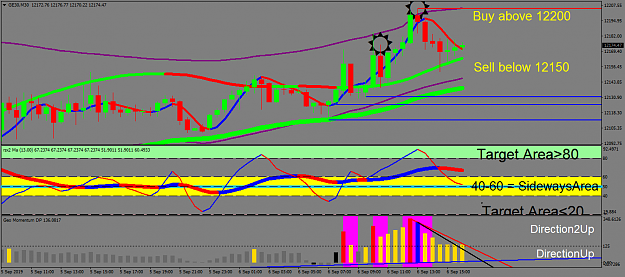
Just to say this is how your indicator can be used even MORE effectively. Standard setting with overlay of a 34 setting with all colours, except white, deleted - so you have 2 indicators in one window. The 50 level was important so I put a stronger ...
I will code your EAs and Indicators for no charge
- 2george replied Sep 6, 2019
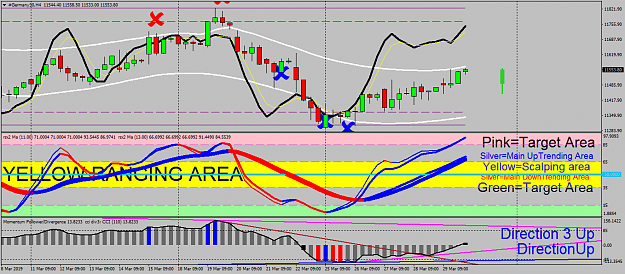
Here is my take on the Dax today. Plus an indicator that should be useful based on CCI-55 showing divergences in the upper timeframe. George
DAX (GER30) - Trading System
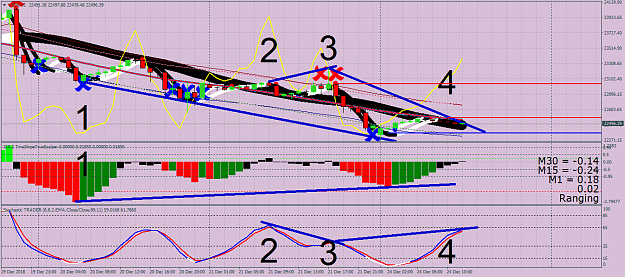
- 2george replied Jun 14, 2019
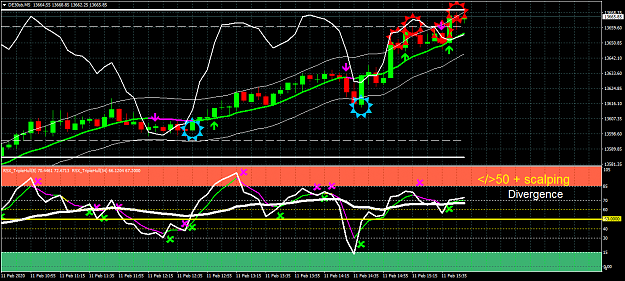
I rarely see Hidden Divergence before the fact but yesterday I saw on both the attached 1hr and 15m Dax charts that there was bearish HD at 10.30am UK time. If there is doubt about HD providing fast springboard moves then look at your own charts for ...
Divergence and hidden Divergence
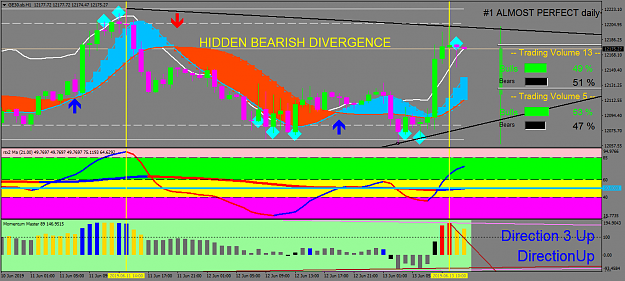
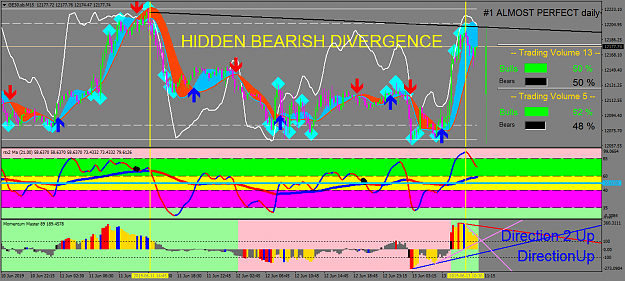
- 2george replied Mar 30, 2019
Bearish – Lower PRICE High – Higher Indicator high – indicates underlying weakness. Not often I see these hidden divergences! I will wait and see the result next week as there is plenty of bullish momentum on the lower timeframes. George
TMT Scalping System
- 2george replied Mar 20, 2019
Here are a couple of indicators that link together really well for day traders and scalpers. George
Something Interesting You Can Post Here
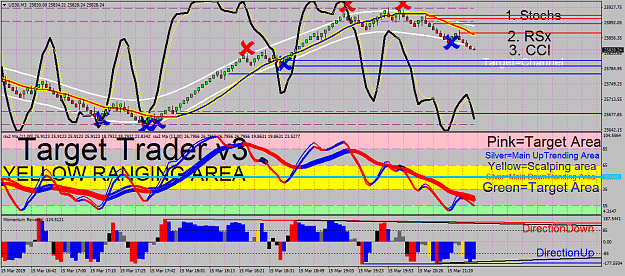
- 2george replied Mar 15, 2019
To all scalpers I will share what is the most accurate and safe template I have created. Attached are the indictors - the Buzzer is an extra that you can add if you wish. It is designed for use with Renko. The illustration is 7.5 points each block. ...
TMT Scalping System
- 2george replied Mar 7, 2019
I missed several opportunities to join this trade - waiting. George
Hidden divergence
- 2george replied Jan 7, 2019
I believe this thread is under used but it is probable that few traders are using CCI divergence. To those who are using it I attach a very good MT4 CCI 'divergence predictor' which importantly shows the next upper timeframe zero cross in a yellow ...
CCI Divergence 5mn
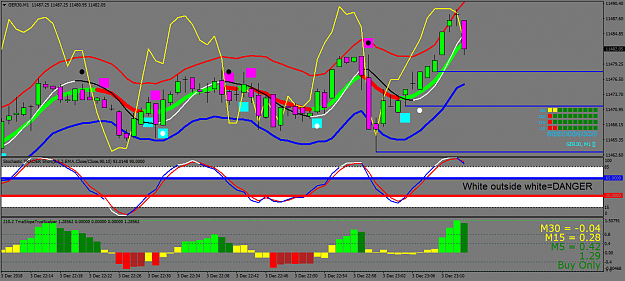
- 2george replied Dec 24, 2018
Bearish Hidden Divergence on the Dow Jones 1hr chart. Lower PRICE High – Higher Indicator high shown between 3 and 4 . Very similar stochastic setting - mine is 8-8-2-1. Unfortunately there is bullish divergence on the TMA so it is a wait and see ...
Hidden divergence
- 2george replied Dec 3, 2018
I think this is a better indi and recommend it is used with stochastics setting 8-5 (slow) - 2 (D) - 1 (ema). Illustration of TMA and stochs on a 1m Dax chart. George
Extreme TMA System