- Search Forex Factory
- 25 Results
- seemoore replied Feb 15, 2019
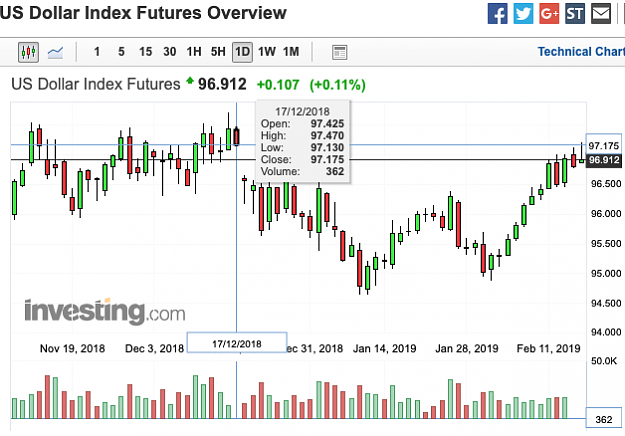
DXY also closed that gap from 12/17 - 12/18, so another reason for DXY reversal (I have no idea how long, maybe just minor). image
Entry Unholy
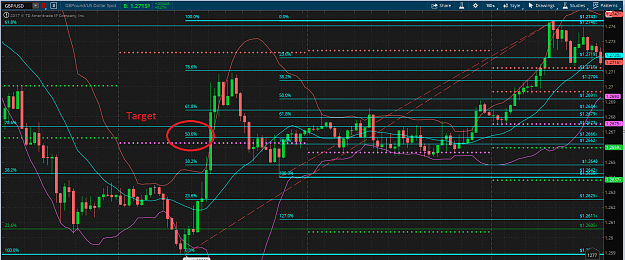
- seemoore replied Jun 23, 2017
GU, hit 1.27, bull butterfly?; targeting back down to 50% of the butterfly, let's see:
Mr. Scott's Crayon Thread
- seemoore replied Mar 17, 2017
Thanks to all of you who provide such thoughtful posts. Perhaps I missed it, but (and I like many who follow this thread have essentially no FA background or education) I'm not seeing that GDP projections may also have a significant impact on the ...
The Really Useless Thread
- seemoore replied Dec 2, 2016
1. I'm still learning, so my opinions may be terribly uninformed. 2. Today's report that I think the bond market is reacting to is just a pullback. We've been on a dollar and bond yield run for weeks now. Today was either continue or pullback time. ...
The Really Useless Thread
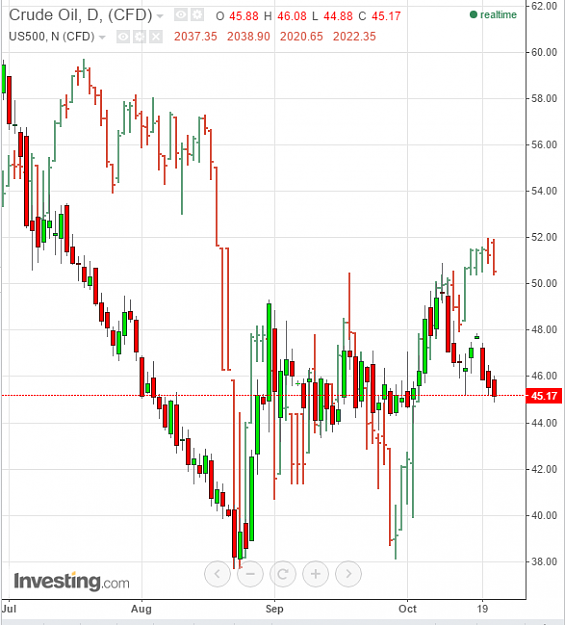
- seemoore replied Oct 21, 2015
Lately, crude falling has been bad for SP500. Crude is the canary there. image Edit: On the pic, Crude is the filled in larger candlesticks. SP500 the others.
The Really Useless Thread
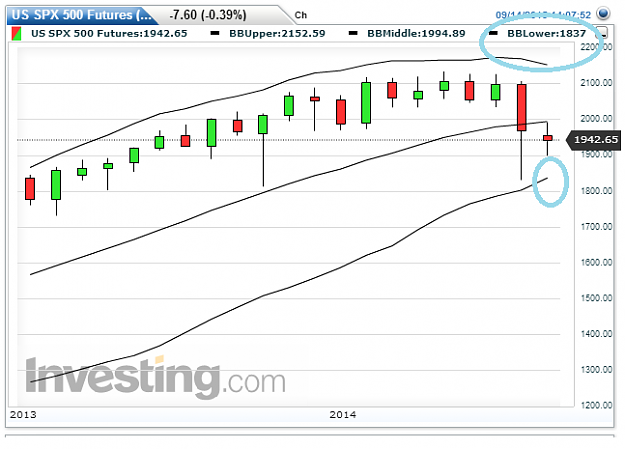
- seemoore replied Sep 14, 2015
Bollinger band. image Take a look at how often it protects price from extremes. I find it very useful.
EURUSD
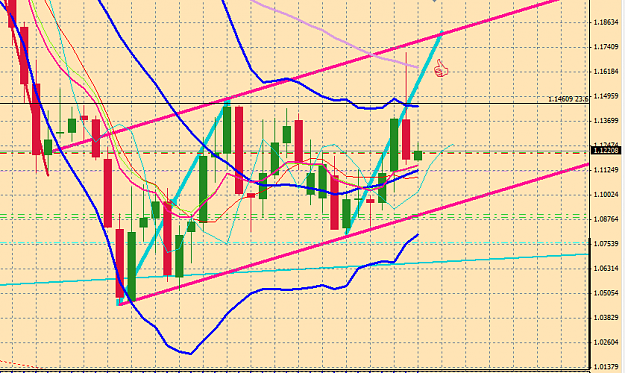
- seemoore replied Aug 31, 2015
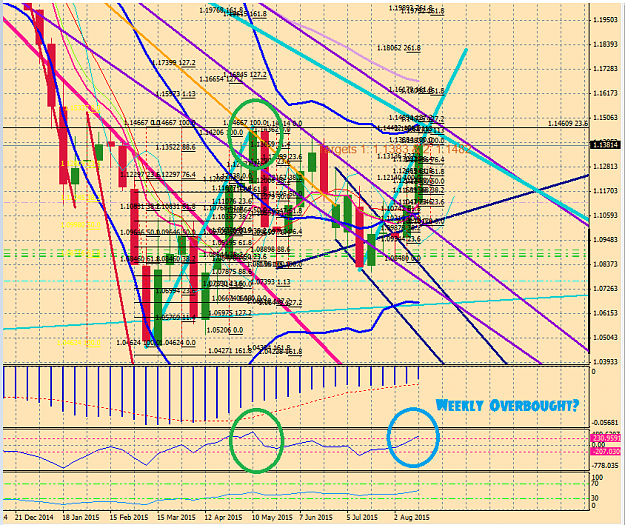
Pretty interesting potential pattern on weekly. The light blue lines are the weekly ABCD, which on a time scale would complete the week of Sept 17th Fed mtg. The pink trendlines are a parallel flag pattern. Who knows, but the market set up the move. ...
The Really Useless Thread
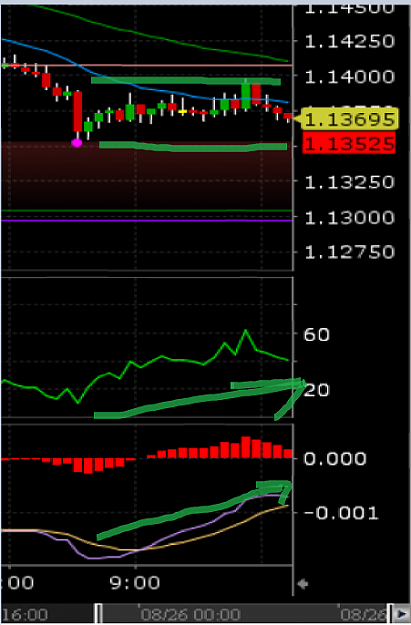
- seemoore replied Aug 26, 2015
The high shown on the attached chart in crude was 10:29. The low in crude was 10:37. See attached chart (doesn't show minutes but you can look them up at investing.com or on your feed as I did). image EU had a small red candle at 10:30 then started ...
EURUSD


- seemoore replied Aug 26, 2015
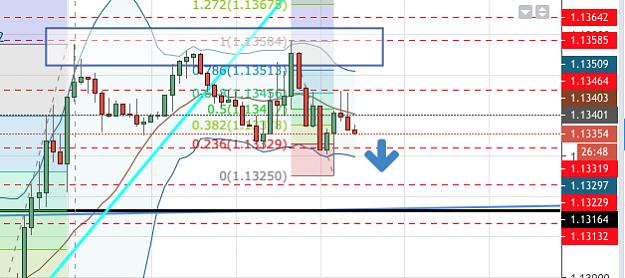
Looks like some bearish dynamic pressure on 5m EU chart. I'm targeting 1.13. image
EURUSD
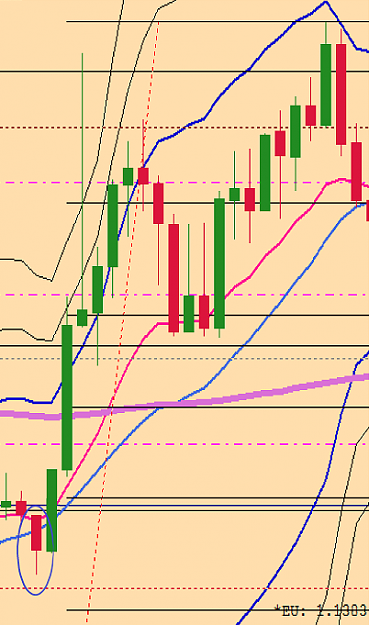
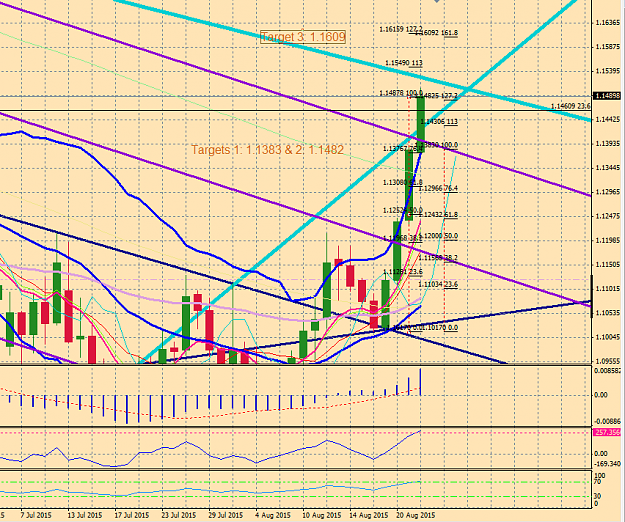
- seemoore replied Aug 24, 2015
Update to my post yesterday on EU board. Should have posted here. Next target on EU is 1.1609, the 161% extension of 848-1214 leg. As I type, 1505 just broken, argh. Anyway, noteworthy for me that DOSC is officially in oversold on daily & weekly ...
The Really Useless Thread
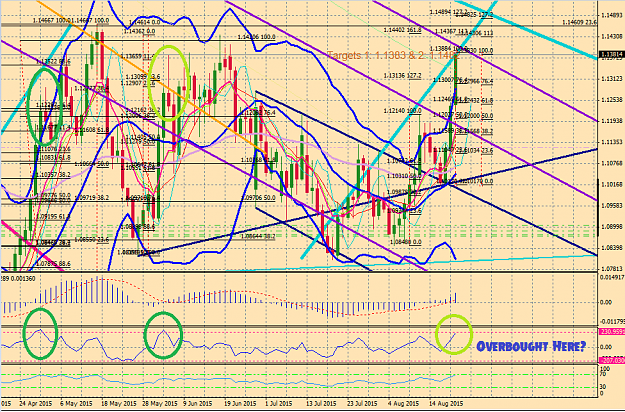
- seemoore replied Aug 23, 2015
My thoughts on EU. First I was wrong on the Friday afternoon shorts. So it goes, but should have seen it coming. Where from here? As has already been posted by others, there is numerous resistance at price & just above. We have historical sellers in ...
EURUSD


- seemoore replied Aug 20, 2015
Whoa! There are some big boy bulls driving this bus today. Stomping those bears. image
EURUSD

- seemoore replied Aug 17, 2015
Me too. Pretty tricky PA it seems. But starting to look like the shorter timeframes want to go long a bit. Potential ABCD on 15m shows about 1.1138ish is target.
EURUSD

- seemoore replied Aug 13, 2015
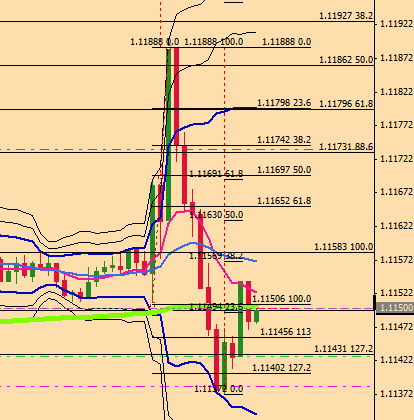
Agree. May retrace to 1.1124 first given the quick hit at 1.1145 (lower 1.618 extension). image
EURUSD

- seemoore replied Aug 13, 2015
A. the Holy Grail of FX trading (fully explained in pic below) image B. a basketball move image C. when you point out anything of interest in the background behind that hot girl you looked at when your wife/girlfriend gives you a dirty look ...
EURUSD


- seemoore replied Aug 12, 2015
Did EU just make the AB leg of a shark pattern? (I'm still trying to figure out all these harmonic patterns). If so, what is the minimum target of the BC leg? 1.1220? I understand it is 1.618-2.24 of something, but I don't know where to measure ...
Mr. Scott's Crayon Thread