- Search Forex Factory
- 26 Results
- purzel replied Nov 6, 2012
The two 100 % Fibonacci extension levels and the daily S1 provided some support which the market respected so far. image
EURUSD

- purzel replied Oct 23, 2012
The level at 1.2957 created by the 100 % fib extension and the 200 SMA on the 4 hour chart and the daily S3 supported the Euro US Dollar so far. On the daily Euro chart we have a potential bearish "222" Gartley pattern. image image
EURUSD


- purzel replied Oct 22, 2012
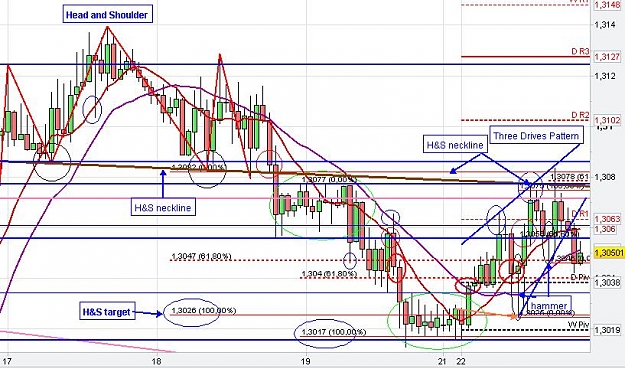
The Euro retraced up to the Head and Shoulder neckline and formed a kind of wedge pattern/ Three Drives pattern before the EURUSD reversed and moved down. image
EURUSD
- purzel replied Oct 20, 2012
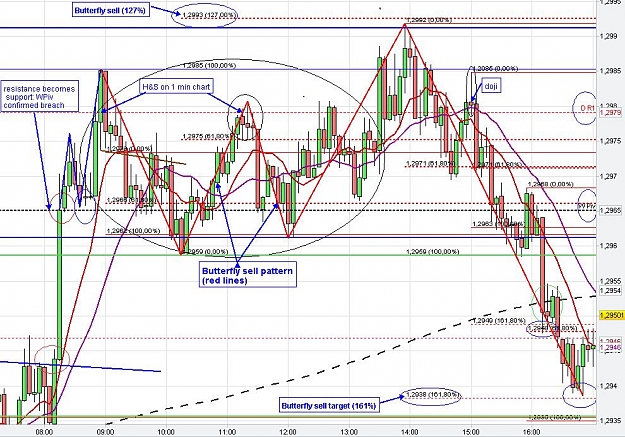
Head and Shoulder — The EURUSD broke below the Head and Shoulder neckline and triggered the Head and Shoulder pattern (EUR/USD Market Recap 2012-10-18). The EURUSD found support at the Head and Shoulder target (100 % fib extension of the H&S ...
EURUSD

- purzel replied Oct 11, 2012
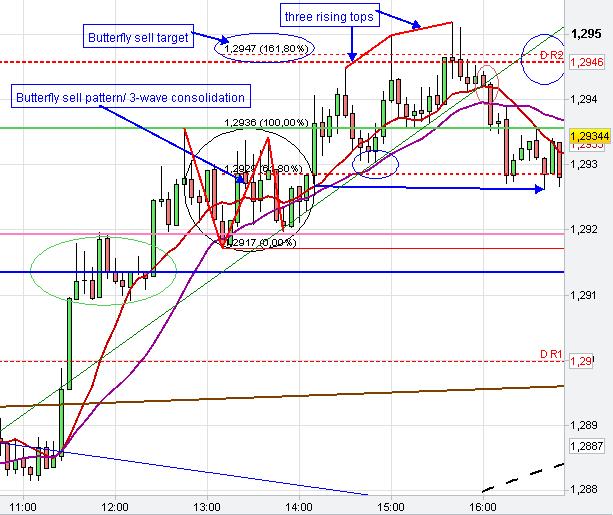
some ideas — Some ideas about today`s trading session. Pivot point S&R (Monthly Pivot, daily S2), candle stick patterns and three-rising-tops-pattern and potential butterfly-pattern image image
EURUSD

- purzel replied Oct 10, 2012
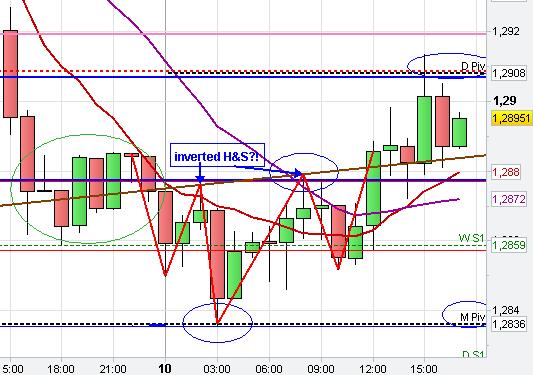
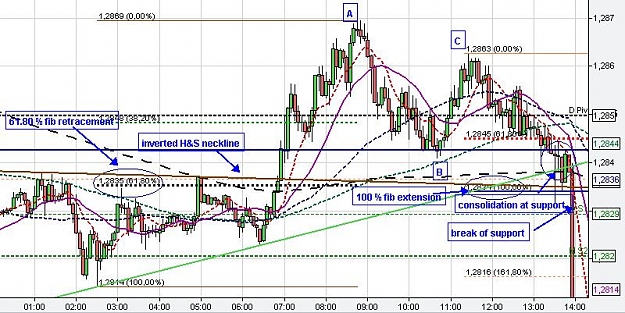
Inverted H&S — Possible inverted Head & Shoulder pattern today. image
EURUSD
- purzel replied Aug 7, 2012
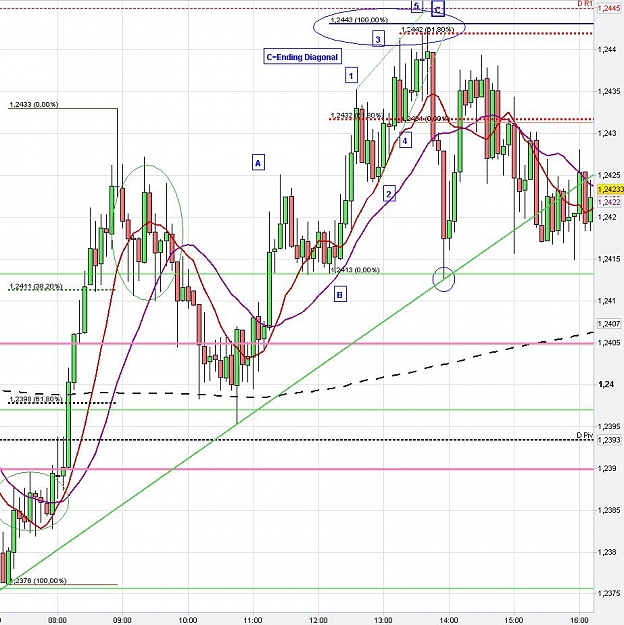
Ending Diagonal Triangle — Today, we had an Ending Diagonal Triangle on the 5 min chart. The Ending Diagonal Triangle is the C-wave (1-5). Market reached the standard target, which is the complete retracement of the C-wave (below point B) at ...
EURUSD
- purzel replied Jul 11, 2012
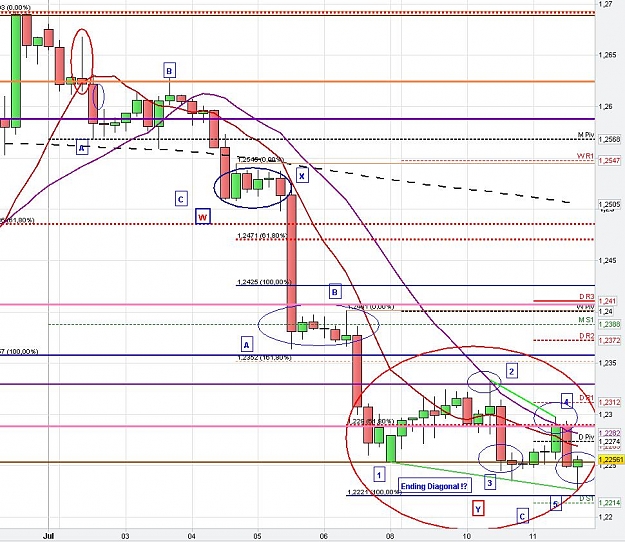
possible Ending Diagonal triangle — Hello, We might see the setup for an ending diagonal on the 4-hour chart. I made a possible EW-count but the main important wave structure is the ending diagonal (red circle 1-5). Lets wait and see... image
EURUSD
- purzel replied Jun 14, 2012
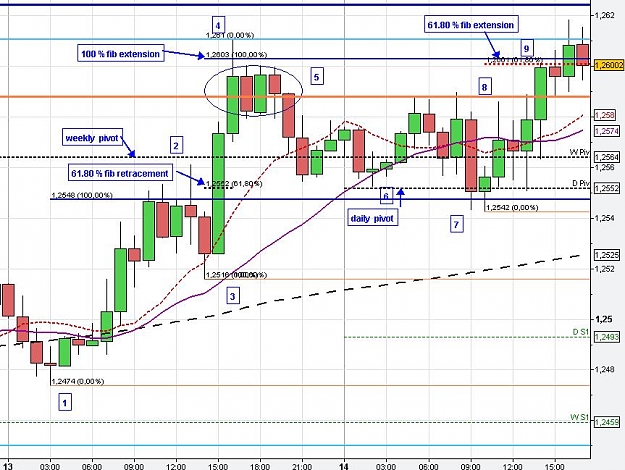
EUR/USD Market Recap 14.06.12 — Yesterday, the Euro found resistance at the 100 % fib extension (1.2603) (4) and bounced back to today's daily pivot point (1.2552) and the 61.80 % fib retracement (6). From there, the Euro form a larger ...
EURUSD
- purzel replied May 17, 2012
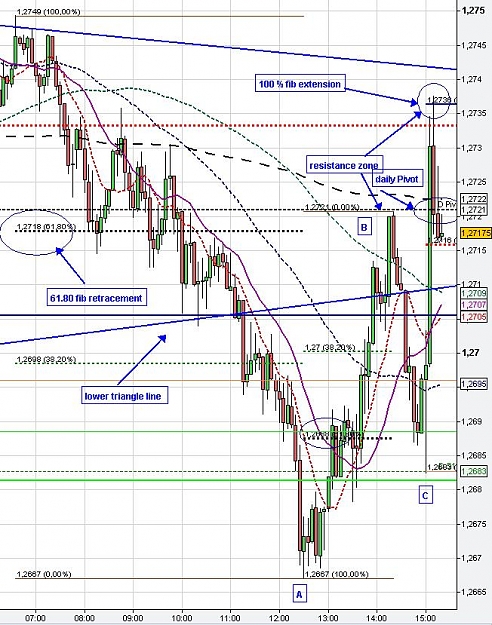
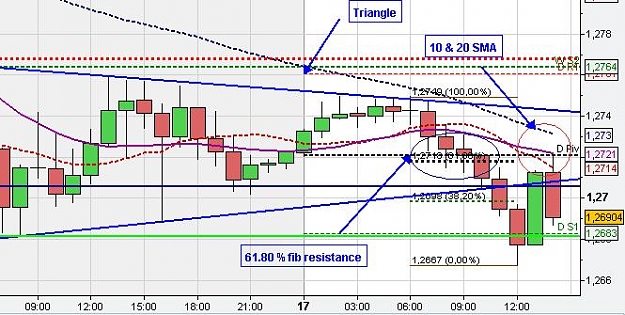
Market Update 17.05.12 -C- — After news release at 3 p.m. GMT market found support at the 61.80 % fib retracement at 1.2688 and the daily S1 at 1.2683. In the following market broke through the prior resistance level at about 1.2721 (no ...
EURUSD
- purzel replied May 17, 2012
Market Update 17.05.12 -B- — Market retraced back in the triangle body, which as a consolidation pattern (triangle) very often gives resistance. Market found resistance at the 61.80 % fib retracement of the recent swing down, the Pivot point ...
EURUSD
- purzel replied May 17, 2012
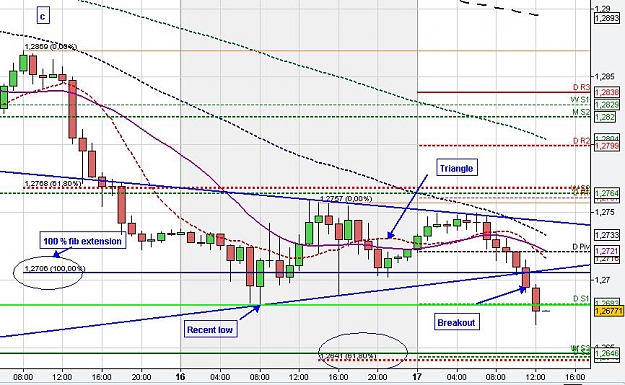
Market Update 17.05.12 -A- — On the hourly chart we had a nice triangle consolidation (blue lines) after yesterdays drop down, which, as mostly, is a continuation pattern. The triangle pattern took place at the 100 % fib extension at about ...
EURUSD
- purzel replied May 16, 2012
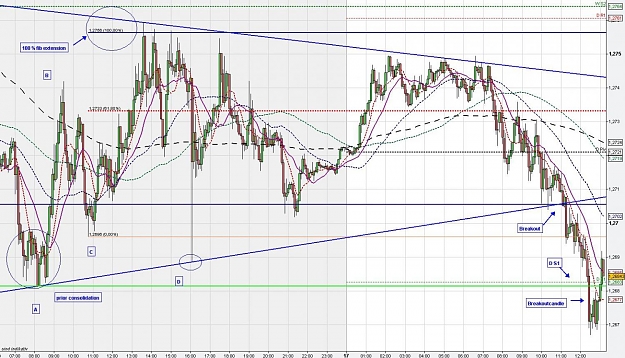
Market Update 16.05.12 -A- — Market dropped down further (strong momentum) yesterday and today and found some support at the 100 % fib extension from a-b at c at about 1.2706, daily S1 and the gaps from January 2012 in this zone. The ...
EURUSD
- purzel replied May 16, 2012
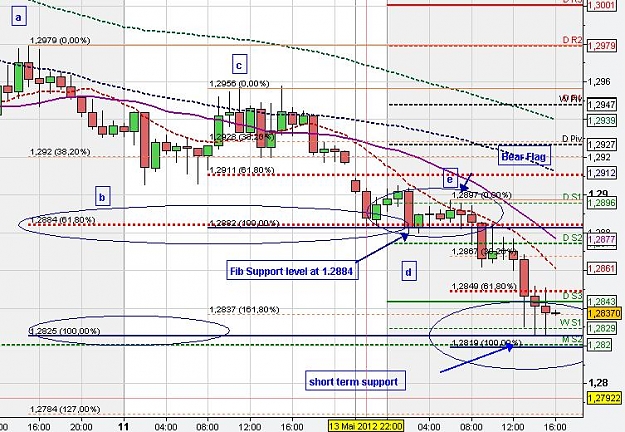
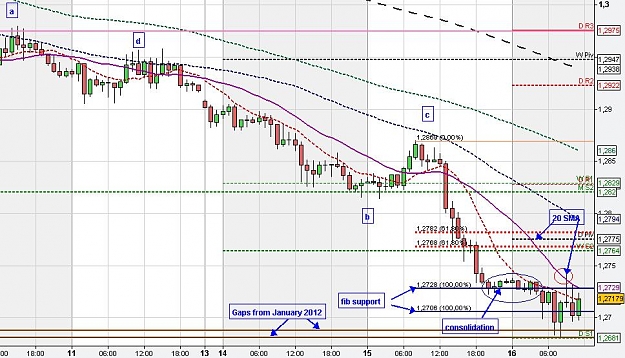
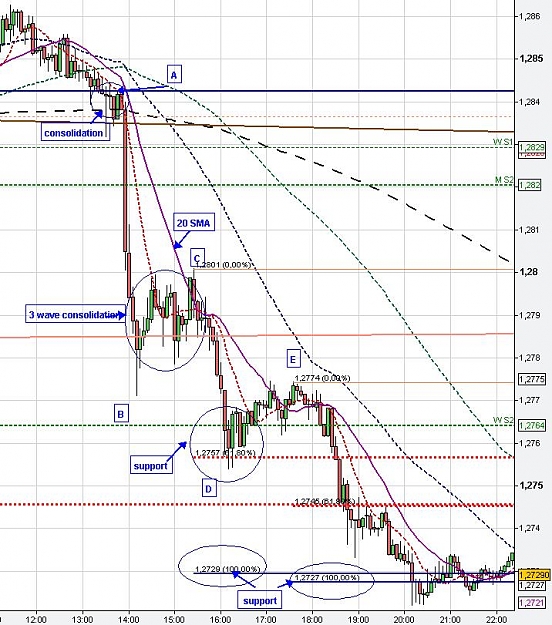
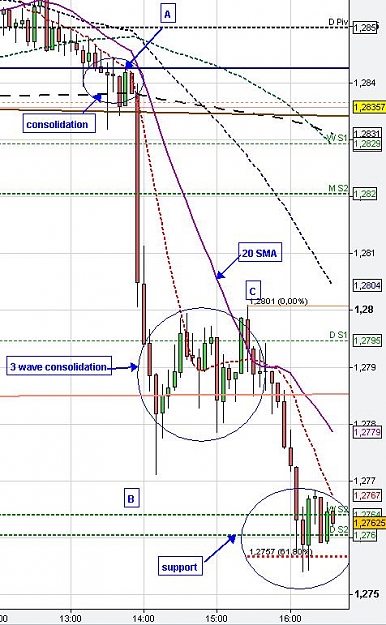
Understanding price movement (7) (fibonacci studies) — After the wave down (A-B)yesterady in the European Session market consolidated (typical 3 waves) and market found resistance at the decreasing 20 SMA and the 1.28 round number. Market ...
EURUSD
- purzel replied May 15, 2012
Understanding price movement — After the recent wave down (A-B) today in the European Session market consolidated (typical 3 waves) and market found resistance at the decreasing 20 SMA and the 1.28 round number (Market was also not able to ...
EURUSD
- purzel replied May 15, 2012
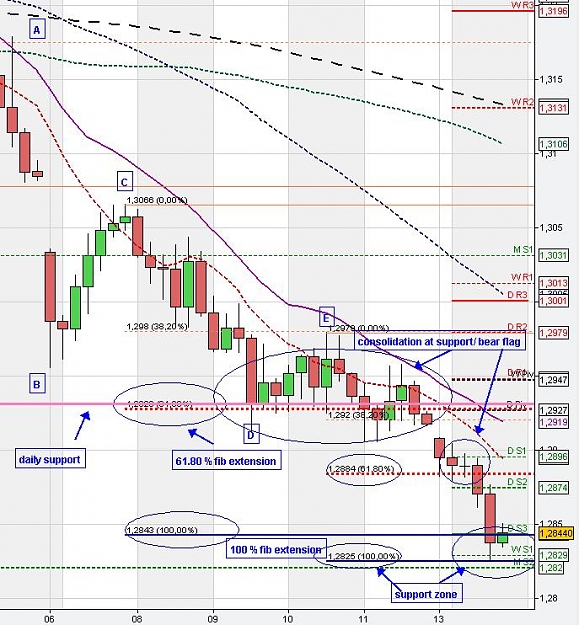
Understanding price movement — The support zone at 1.2825 (analysed in EUR/USD Market Analysis (14.05.12)) which held the market in the yesterday and in the Asian session (got tested) could not hold a second time and got broken recently. On ...
EURUSD
- purzel replied May 15, 2012
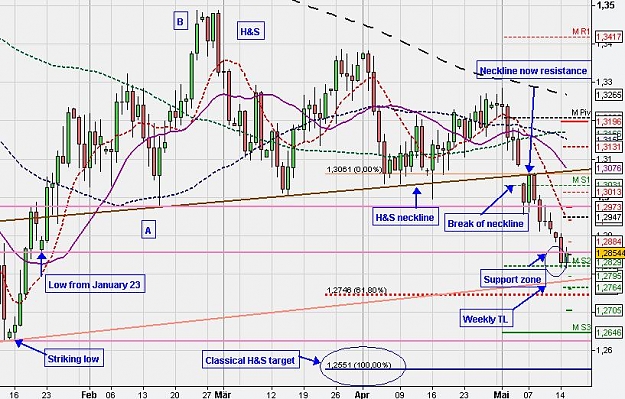
EUR/USD Market Analysis (15.05.12) — The Head & Shoulder on the daily time frame got triggered due to the gap down last week. On monday, May 7, we had a nice retest of the neckline, which acted as resistance and led to a sharp price drop. The ...
EURUSD
- purzel replied May 14, 2012
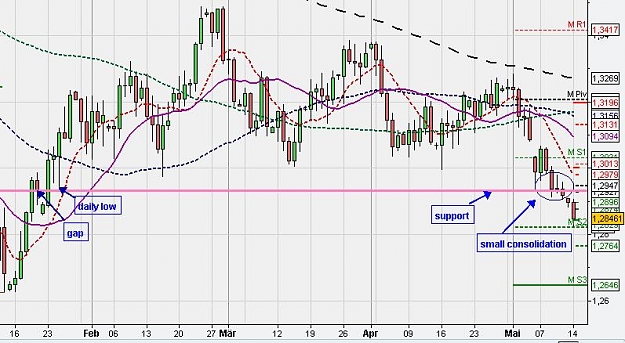
EURUSD Market Analysis — At the daily chart we had a small consolidation last week (circled) at the 1.2931 support level created by the daily low from january 25th and the gap from January 23. Oh the 4h chart we see that the daily support and ...
EURUSD