- Search Forex Factory
- 25 Results
- neltonbenke replied Jan 31, 2014
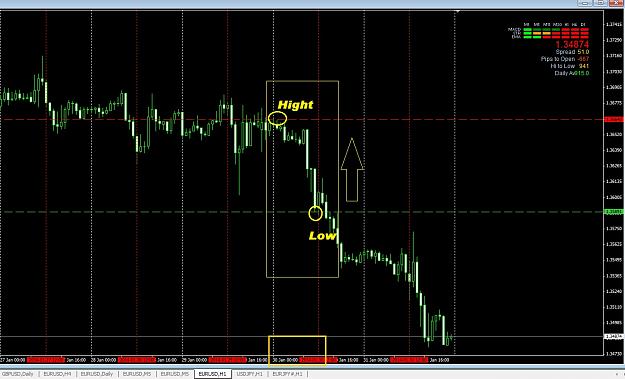
Marked areas of high and low in the first 12 hours. Are correct or am I doing wrong?
AMAZING Strategy!!!
- neltonbenke replied Oct 21, 2012
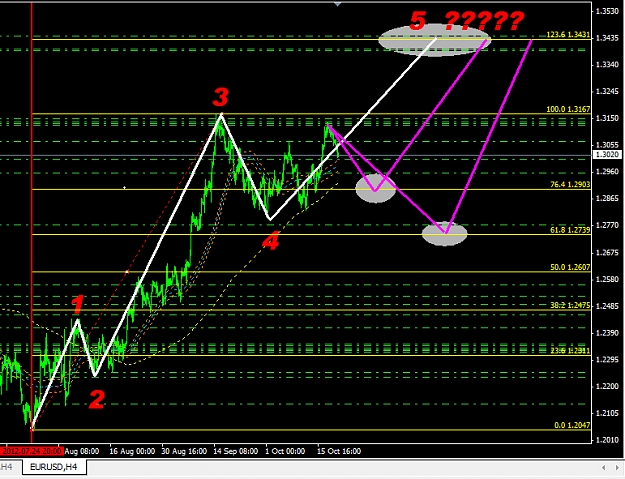
EU H4 — is it possible? I am new to Wave......Eur / Usd H4
Elliott wave outlook
- neltonbenke replied Oct 14, 2011
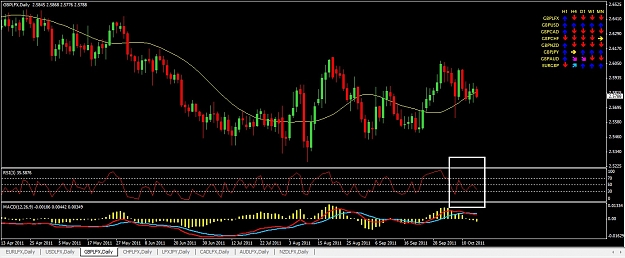
Capito This is an image of GBPLFX, closing today. How do you interpret the RSI in these conditions in order to swing it enough. Necessarily it must rise above 70 and get down and go below 30 and start climbing, because in some situations it is down ...
CICR system (Currency index cross referencing)
- neltonbenke replied Oct 12, 2011
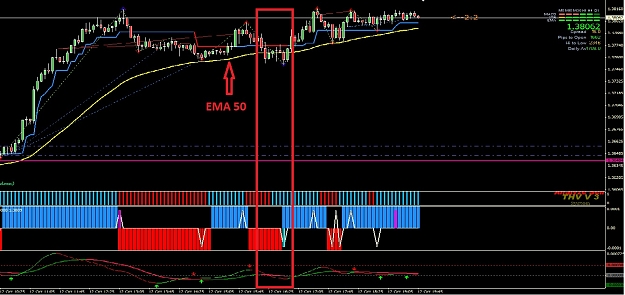
SNEID Btw, your strategy is fantastic! 1st time use it and gained more than 100pips today held from asian session to UK session. Wonderful combination. I add EMA50 to 5min TF so as to act as a visual filter to prevent enter at wrong direction. If PA ...
Symphonie Trader System
- neltonbenke replied Nov 4, 2010
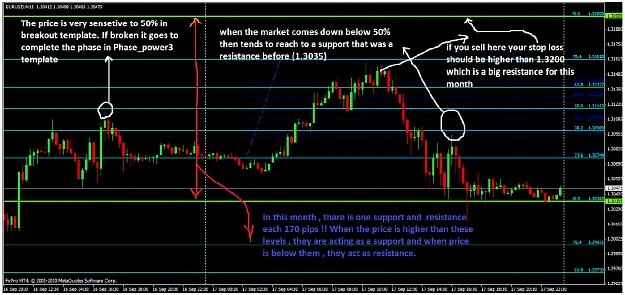
Screen explaining about when is 50%.
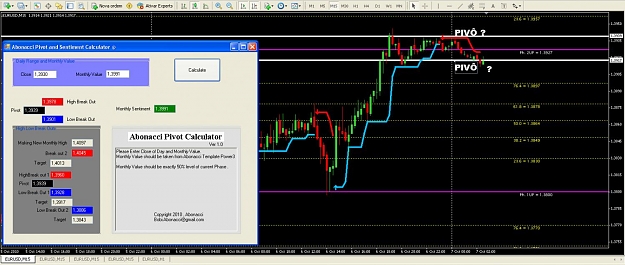
Aboonacci System - for EUR/USD prediction
- neltonbenke replied Nov 1, 2010
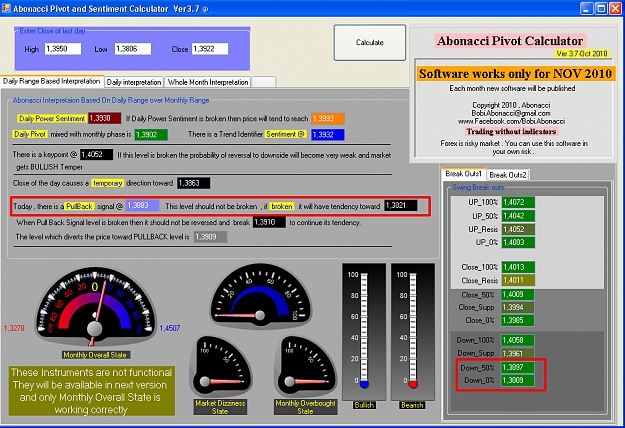
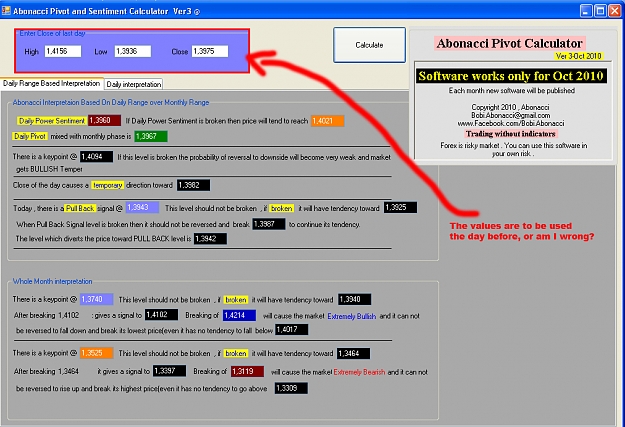
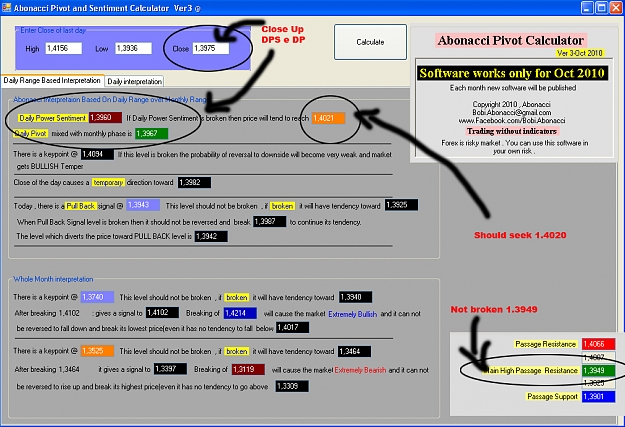
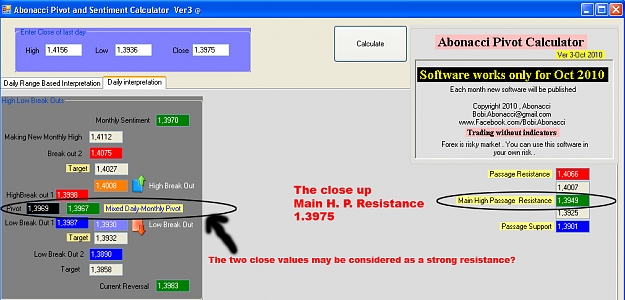
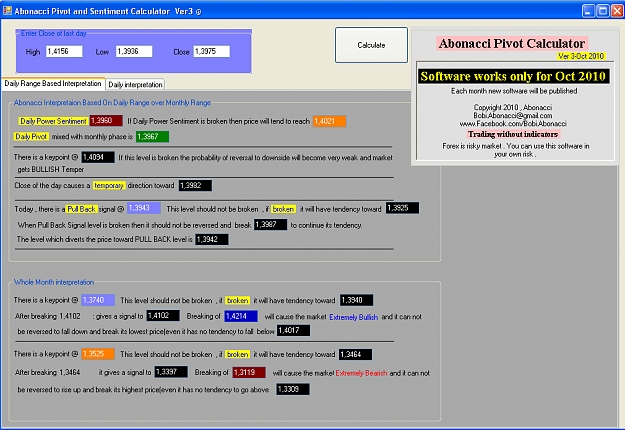
Dear Bobi The figures are repeated .... is this correct?? Close is the closing session of the European
Aboonacci System - for EUR/USD prediction

- neltonbenke replied Nov 1, 2010
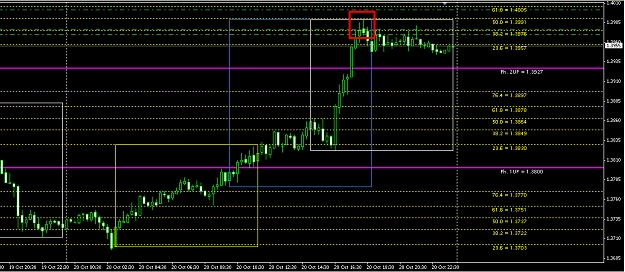
Dear Bobi The pullback today is 1.3883 and 1.3821 can reach break (highlighted red). 1.3897 and 50% broken Dow reaches 0% 1.3809 Could you explain those values, they are very close but which is more reliable then. Thank you.
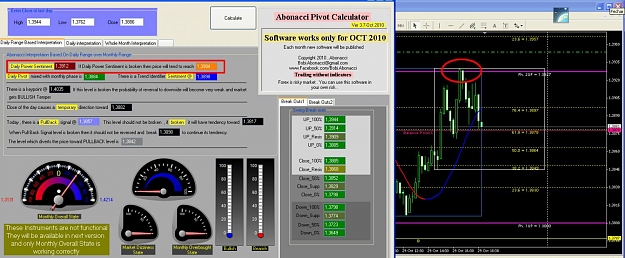
Aboonacci System - for EUR/USD prediction
- neltonbenke replied Oct 29, 2010
Understanding the future — The price broke the 1.3912 and following calculator should go to 1.3994, but fell to 1.3879 by changing the interpretation following my understanding. As a suggestion I would comment on the future and not about the ...
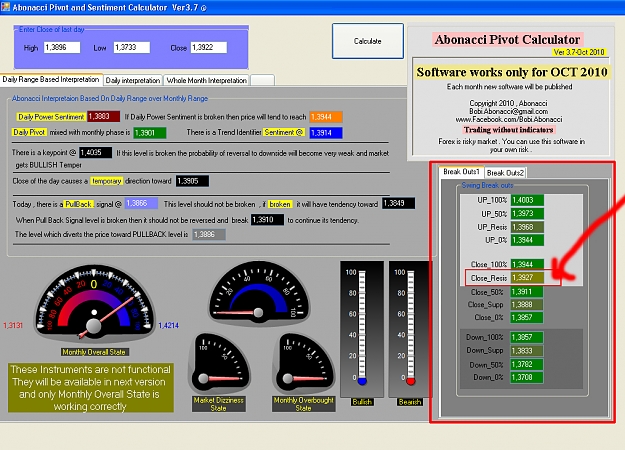
Aboonacci System - for EUR/USD prediction
- neltonbenke replied Oct 28, 2010
My question is: The price hit .3944 in exactly what was going through our tp resistance in .3927, the price came back and went through the resistance (now supported in this case) more than 2 pips. The question is as follows, as it came from above ...
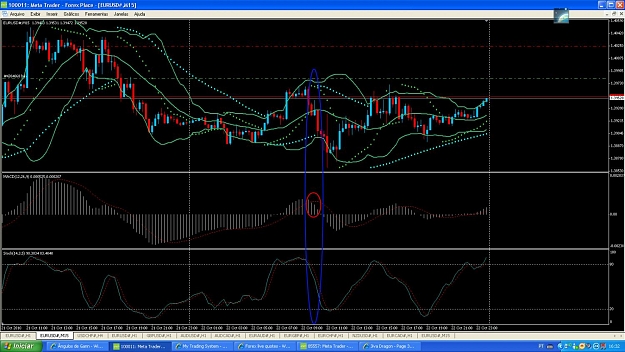
Aboonacci System - for EUR/USD prediction
- neltonbenke replied Oct 24, 2010
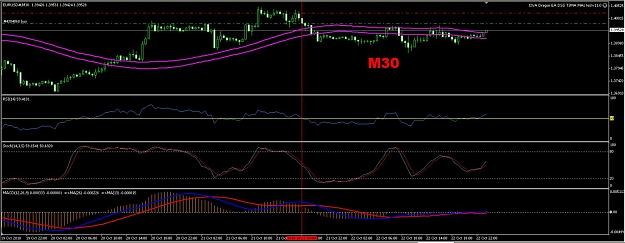
I agree, very good MACD to identify trends. Look where the red line is outside the lines in chured macd and put a case in which Stochastic is also showing fall. Good entry opportunity.
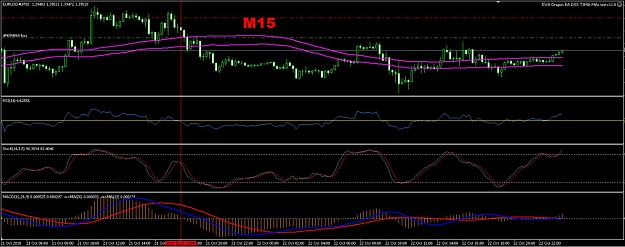
Jiva Dragon
- neltonbenke replied Oct 24, 2010
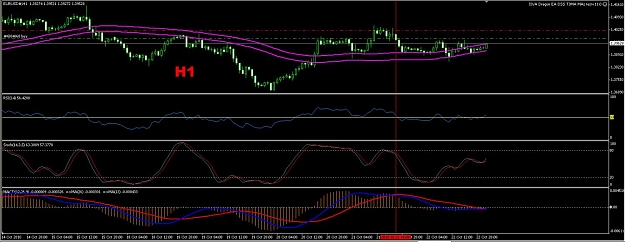
A simple opinion to add to this great topic of dedicated traders. The alignment of indicators would be a great help to refine more entries. Look at the images in h1, m30 and m15. The entry in position so happens when all these tfs are aligned, ie ...
Jiva Dragon
- neltonbenke replied Oct 22, 2010
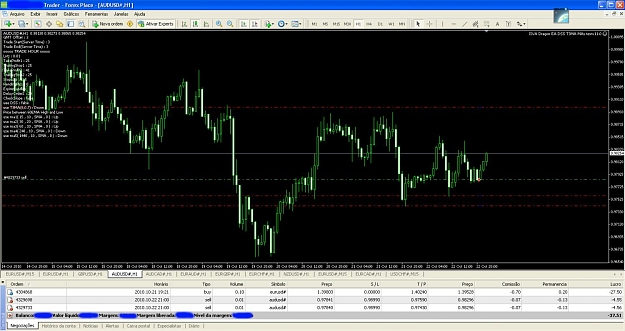
EA has opened these two orders in the middle of AU 0:01 pm today. I stopped to see how it will end. Soon after the conditions were unfavorable. But I'll wait to see how he reacts. The other order was in the U.S. manual.
Jiva Dragon
- neltonbenke replied Oct 20, 2010
It reached 1.3989, exceeded 38.2% at 13 pips can be considered broken and wait for 100% of phase 3?
Aboonacci System - for EUR/USD prediction
- neltonbenke replied Oct 16, 2010
[Quote = hutrader; 4100879] Nelton, que tal um presente? Veja minhas imagens em anexo. 1,3925 é chamado a minha atenção aqui novamente. No entanto, se [/ quote]
Aboonacci System - for EUR/USD prediction
- neltonbenke replied Oct 16, 2010
[Quote = hutrader; 4100762] Olá a todos, Foi interessante durante a Ásia. Alguns já pensaram que a Ásia vai puxar para o lado negativo. Bem ele fez. E rápido. mas olhando para a calculadora. O que começou esta Abonacci (Bobi) já disse, já podemos ...
Aboonacci System - for EUR/USD prediction
- neltonbenke replied Oct 6, 2010
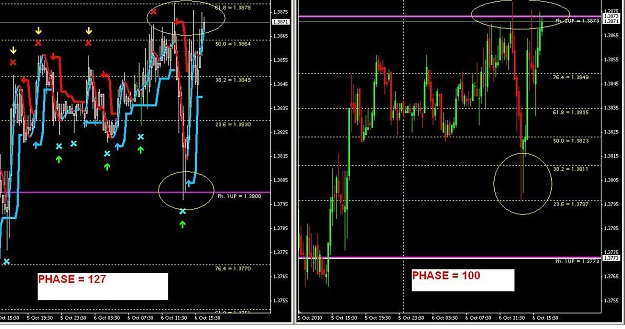
What phase should I use for calculation? values are different.
Aboonacci System - for EUR/USD prediction
- neltonbenke replied Oct 6, 2010
I still have my doubts about the stage this month. Seems to me that 100 is fair.
Old Dog Fib Trading - EURUSD
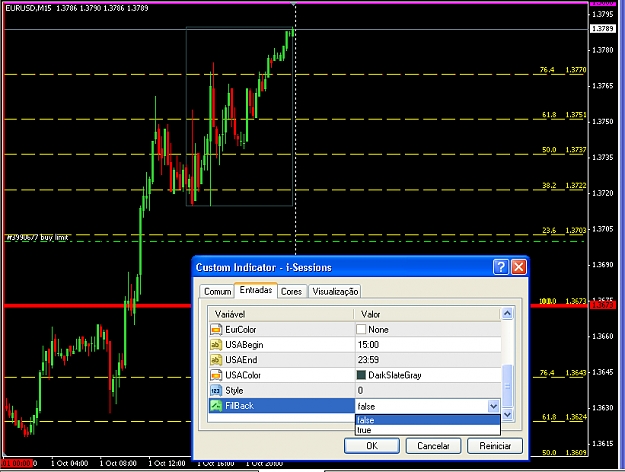
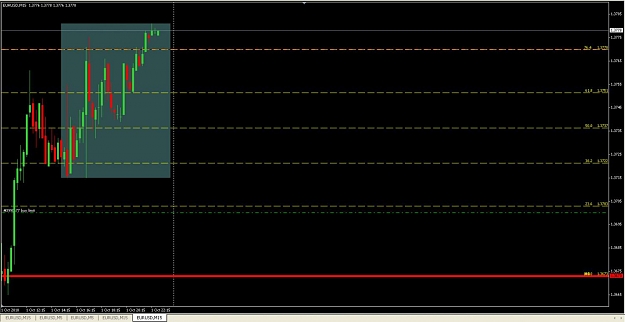
- neltonbenke replied Oct 1, 2010
I am posting another indicator with two functions, you can see and compare the two. In this you can even disappear with this rectangle and leave only the contour
Old Dog Fib Trading - EURUSD