- Search Forex Factory
- 15 Results
-
 naminori replied Jul 16, 2008
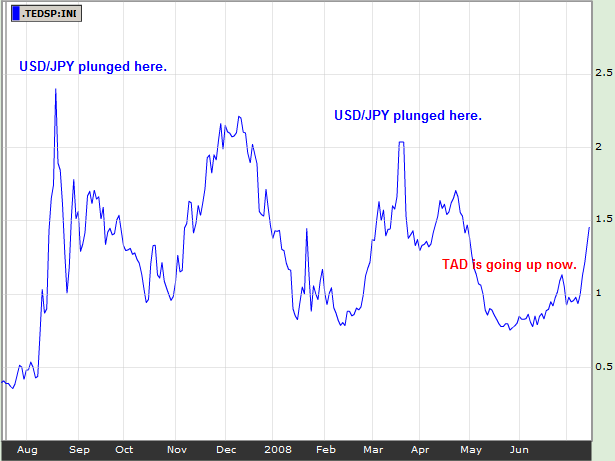
One way to look at USD/JPY - TED spread — Most of you have realized that USD, and the US economy has been DEEPLY in trouble, even though it was tentatively lifted from around 103.80 in the previous NY session as a result of oil price's plunge. ...
USD/JPY Discussion
- naminori replied Jul 10, 2008
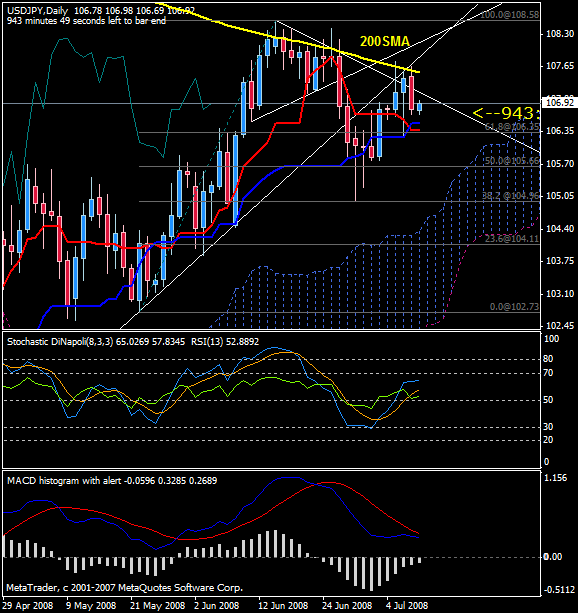
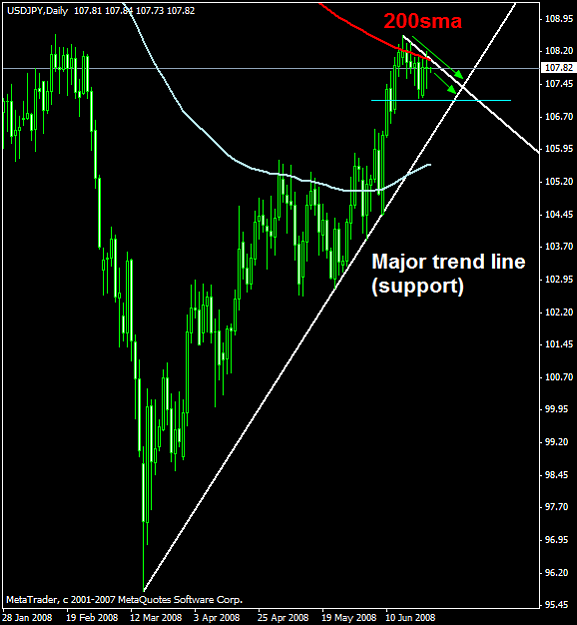
Heavy selling pressure lie ahead — Heavy selling pressure seems to lie ahead, especially around 200SMA. What would you do, if you were a big player? I would move the price lower to clean those long positions out of the market.
USD/JPY Discussion Or I may be ...

- naminori replied Jul 10, 2008
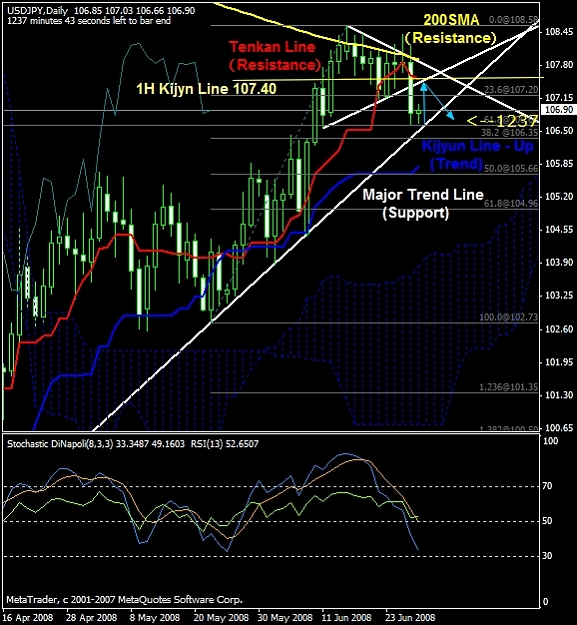
ak4x, On my daily chart, 200SMA is located way above your 200SMA. How did you plot the 200SMA on your chart? As you can see, the 200SMA on my chart has been a critical resistance for the past weeks.
USD/JPY Discussion
- naminori replied Jul 4, 2008
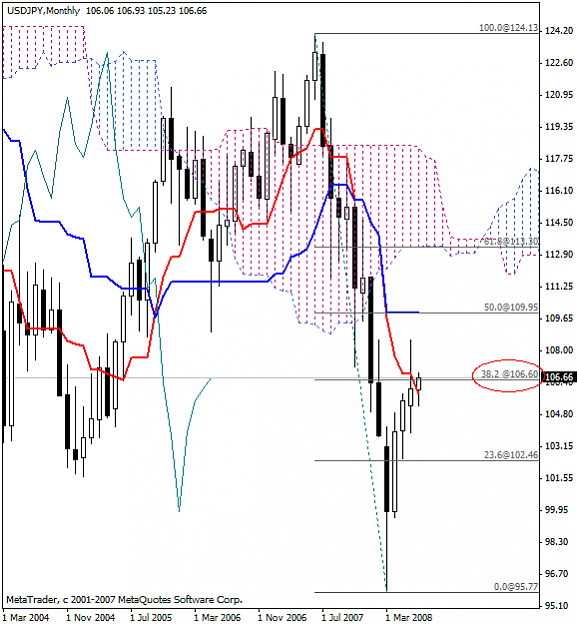
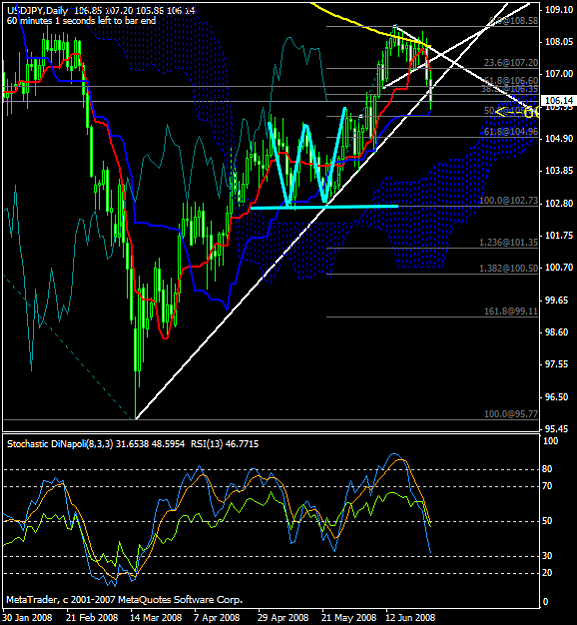
On the monthly chart — USD/JPY is hovering around a very critical price level on the monthly chart right now...
USD/JPY Discussion
- naminori replied Jul 3, 2008
After confirming that USD/JPY had been stalling at around fibo 61.8, I entered short @ 106.74. The initial target is the Kijun line area, 106.22.
USD/JPY Discussion
- naminori replied Jul 2, 2008
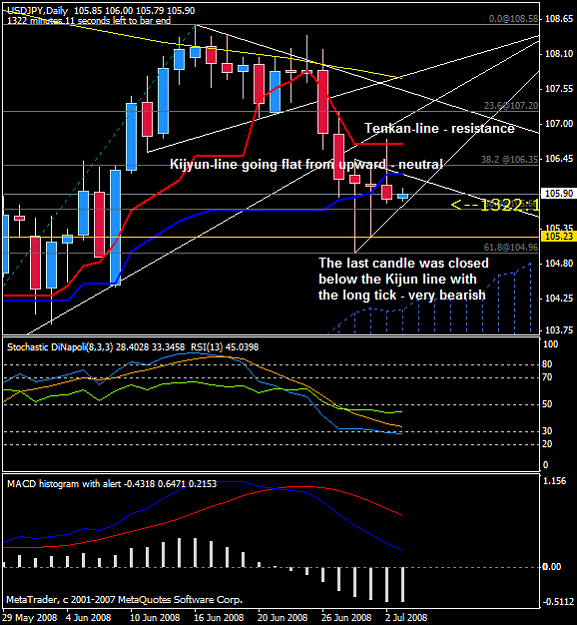
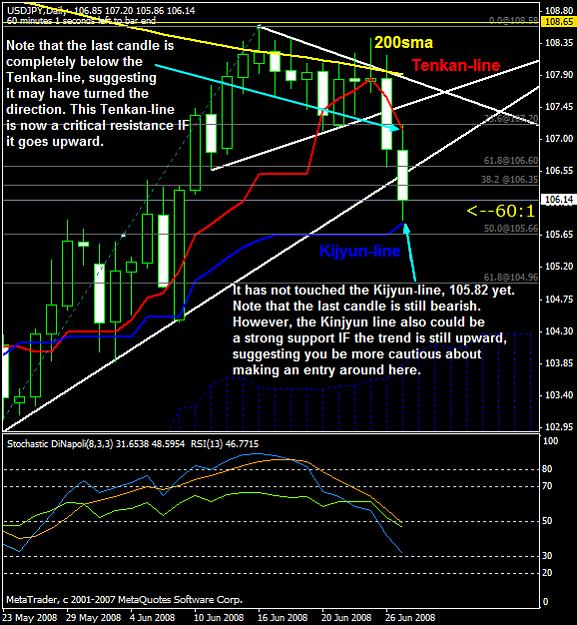
The direction of the Kijyun-line is now going flat from upward, which indicates the trend is neutral. However, the last candle was closed below the Kijjun-line with the long upper wick. This is a very bearish sign after USD/JPY was rejected to go ...
USD/JPY Discussion
- naminori replied Jul 2, 2008
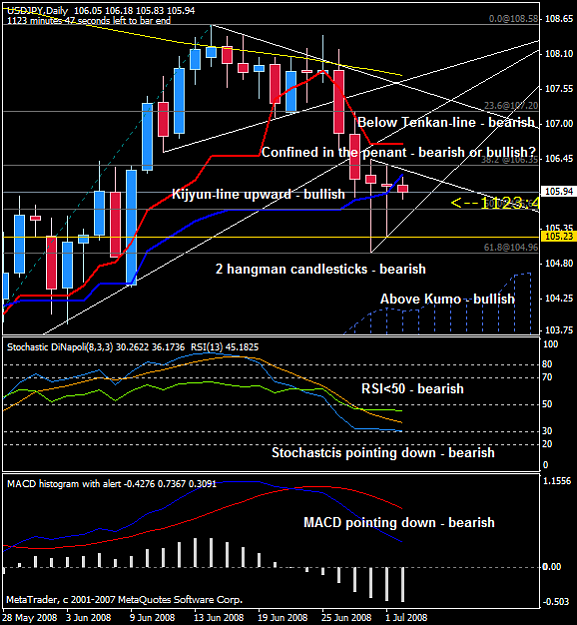
My Ichimoku analysis on the daily chart... Bullish factors: - The price is hovering way above the Kumo cloud. - The Kijyun-line is pointing upward. Bearish factors: - The price is way below the Tenkan-line as well as 200sma. - 2 hangman candlesticks ...
USD/JPY Discussion
- naminori replied Jun 30, 2008
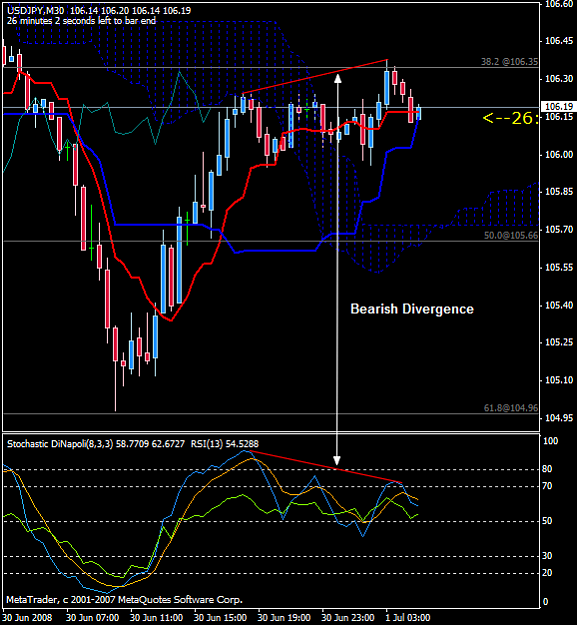
Beaish divergence — Based on that the bearish divergence is forming in the 30M chart, some dips will be expected for the next coming hours. Also note that the price is just below the Tenkan-line in the 1H chart, and the Kijyun-line has started ...
USD/JPY Discussion
- naminori replied Jun 30, 2008
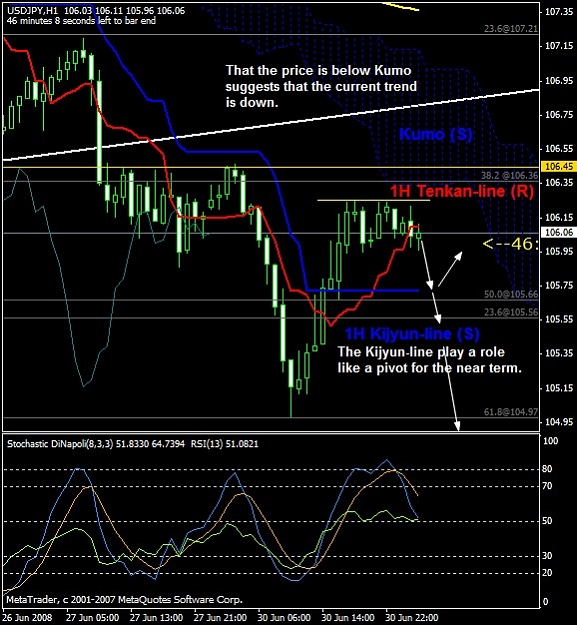
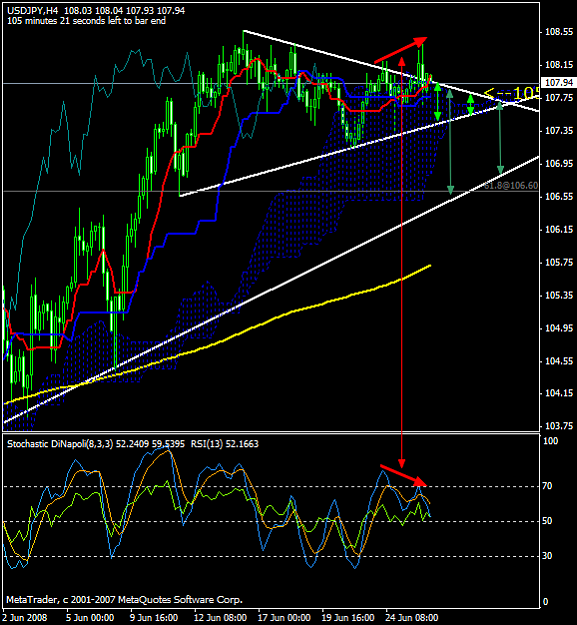
Sell on rally — Things to note based on my Ichimoku analysis... 1. That the price is still below the Kumo suggest that the current trend is down. 2. If the current candle is closed below the 1H Tenkan-line, it is likely that the pair is ...
USD/JPY Discussion
- naminori replied Jun 28, 2008
The Kijyun-line could be a critical turning point. — Some more notes based on my Ichimoku analysis: 1. The 4H last candle is now completely below the Tenkan-line, suggesting that USD/JPY may have turned its direction of the trend from upward ...
USD/JPY Discussion
- naminori replied Jun 27, 2008
Yes, the long term trend is still upward, judging from USD/JPY is still hovering above the Kumo of Ichimoku and above the Kijyun-line, which is 105.82. But we may be in a transitional period at this moment, and it may be reversing its course ...
USD/JPY Discussion
- naminori replied Jun 26, 2008
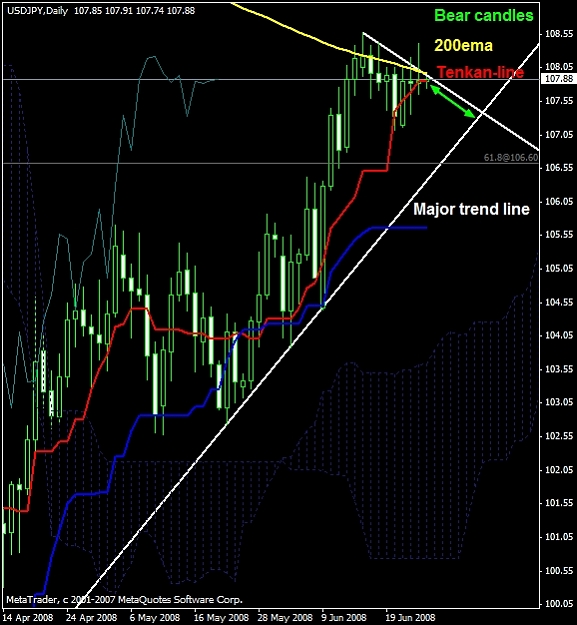
Hi folks. As I was previously pointing out that USD/JPY would hit the major trend line when it was hovering aroung 108.00, the short-term goal was now successfully achieved.
USD/JPY Discussion url Now, I am holding a long position expecting it to climb ...
- naminori replied Jun 26, 2008
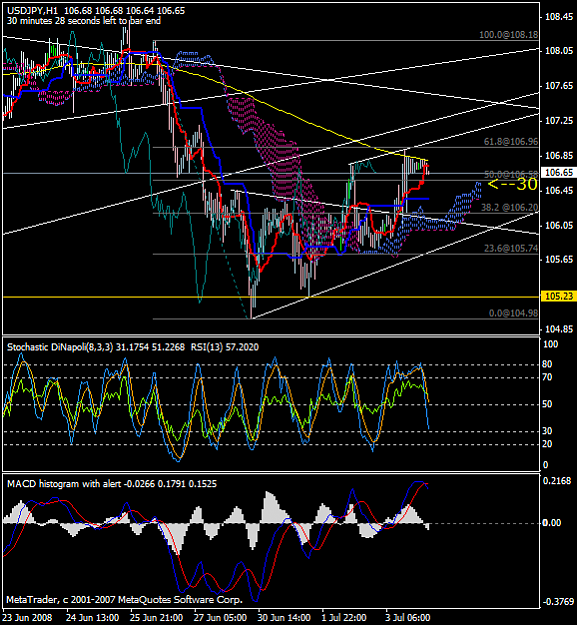
We shall see a breakout sooner or later...possibly in the Euro session. image
USD/JPY Discussion
- naminori replied Jun 25, 2008
I'm still on the bearish side for the near term. USD/JPY is floating around 200sma and Tenkan link of Ichimoku. There is so much selling pressure around this level althogh it succeeded to break the 200ema before the FOMC meeting but again failed to ...
USD/JPY Discussion
- naminori replied Jun 24, 2008
Not so bullsih — I am on the bearish side as opposed to some people on this thread.
USD/JPY Discussion USD/JPY has tried breaking 200sma on a daily chart several times, but failed to hold above it. Although the main trend seems to be still up, this shows ...
- Posts by Member Search: 'naminori'