- Search Forex Factory
- 98 Results (1 Thread , 97 Replies )
-
 jayjonbeach replied Nov 8, 2012
Well I am no 'expert' here either, but this is my favourite pattern
Sonic R. System Technically, I guess it qualifies, angle isn't too too steep, and it has a valid shoulder on each side. What doesn't sit well with me is HOW it formed, the big badass candle on ...
- Forexite data - tons of bad bars, what M1 data is better?Started Oct 27, 2012|Platform Tech|0 replies

Okay first of all, this data is free so this is not a complaint or rant thread. I have just ...
- jayjonbeach replied Sep 8, 2012
Here is where I think EU wave 2 is heading, one way, or the other (Gap fill and W1 Trendline test [purple overhead lines]) Afterwords, we have a dandy wave 3 to which will break through the Monthly Neckline (usually how it happens)
Elliott wave outlook
- jayjonbeach replied Sep 8, 2012
Some EU charts. Start off with a BIG bad H&S that basically no one is talking about, not sure why, clear as day (and is the counterpart to the USD one) Next up is a completed Monthly Triangle, and the Weekly close up look at it, and where we might ...
Elliott wave outlook
- jayjonbeach replied Sep 8, 2012
Hey guys. I don't know if EWI still has the same outlook (have not seen their latest) but I do think the bullish case (at least this one) is losing ground here, see first chart. I have not looked at the bearish case closely yet, but here is another ...
Elliott wave outlook
- jayjonbeach replied Sep 8, 2012
Here's something I have been watching for a LONG time, that oddly NO ONE has mentioned anywhere that I have seen. Its a H&S on the USD chart. Now, it looks slightly better on W1, but because it is on Monthly, and very valid on Monthly, the higher TF ...
Elliott wave outlook
- jayjonbeach replied Sep 8, 2012
Well I was going to say, you might want to get GLASSES....
Elliott wave outlook Each leg is a VERY clear a,b,c (3 legs) and you have ABC and D, only E to is left. Not only that, as I mentioned in prior post, the count off the bottom is a horrible impulse if you ...
- jayjonbeach replied Sep 7, 2012
You know what, I just realized my mistake here, damn it I don't know how many times I get caught in this trap (drawing TL from the top) Of course, D is allowed to go as high as B, but not above, so may not even be finished. This will be interesting, ...
Elliott wave outlook
- jayjonbeach replied Sep 7, 2012
Hey guys. Speaking of Gold, did anyone else notice that the "Perfect" Triangle was completely destroyed in the screw the shorts process? There is no good way to count the crap off the bottom as an impulse, it can be done, but its butt ugly. Sure E ...
Elliott wave outlook
- jayjonbeach replied Aug 16, 2012
Gold still in the same Triangle it has been, and stuck in it since May on D1 in tight range. I have it in the "D" wave, and when it touches the bottom TL it will be done D, which could happen today or in next couple of days. That only leaves "E", ...
Sonic R. System
- jayjonbeach replied Jul 17, 2012
I don't know how long you have been trading, but I have been around a LONG time and gave up on Holy Grails probably before you started trading. Not trying to get smart here, just want to make a point. As you know what, that doesn't stop me from ...
Extreme TMA System
- jayjonbeach replied Jul 14, 2012
HI Bass. Could you tell me what Indy it is drawing the green and red lines on this chart? (The stairstep ones) It doesn't look like Supertrend but close to it TIA
Extreme TMA System
- jayjonbeach replied Jul 11, 2012
Here's a nice "Told cha" exactly 2 months and 1000 pips later. Take a look at the chart, the price was 1.2890 at the time and went up to 1.3030. The Elliot wave count I did was looking for 1.1907 minimum for a target, we're now at 1.1953, price ...
Sonic R. System
- jayjonbeach replied May 31, 2012
I can be wrong here, but to me the BB's have made their intentions clear on Ucad. As you can see here, it sure looks like the "news", was just an EXCUSE for the New York BB's to drive price up and retest the resistance and reload short. That is what ...
Sonic R. System
- jayjonbeach replied May 30, 2012
Updated charts on this trade, M15 turning down, M5 in full Sonic mode. Note the huge chunk of volume on M30. Of course the fate of this largely depends on the USD, and so far, its had no real intention of letting up. We'll see what the news brings ...
Sonic R. System

- jayjonbeach replied May 30, 2012
Hi Andy. I hope you don't mind a little friendly advice for this trade. The document I have made is very important, and I don't want to post it until I am completely happy with it. I have covered Risk Management, Trade Management, and Money ...
Sonic R. System
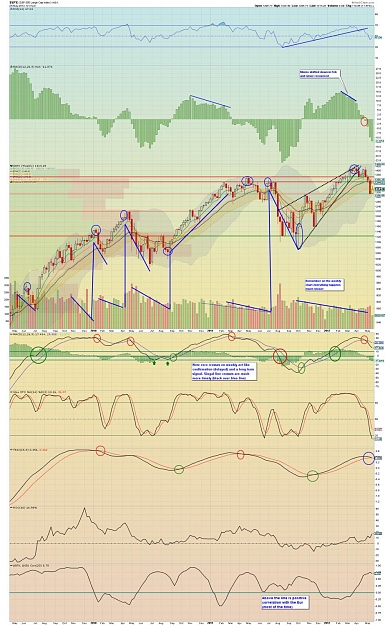
- jayjonbeach replied May 30, 2012
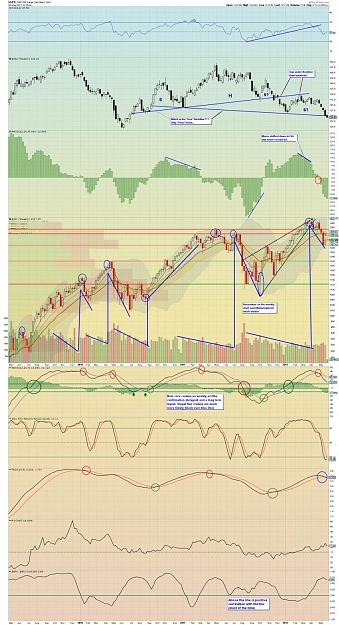
Here is an updated Weekly chart of SPX and EUR (closely correlated, see bottom of chart). Eur are the black Candles. Note that the USD has already closed above its Neckline last week. As you can see on the EUR, it doesn't matter which is the ...
Sonic R. System


- jayjonbeach replied May 24, 2012
Updated chart of the SPX Weekly. At the bottom, you see the correlation to the EUR, which is most of the time, so in other words they move in Tandem.
Sonic R. System
- jayjonbeach replied May 24, 2012
I know I promised to shut up about these, but I just find them so compelling. Anyway, this is a very curious chart. I made some notes on it. Volume would "appear" to be telling us what is likely to happen, but of course no one knows. I am going to ...
Sonic R. System