- Search Forex Factory
- 23 Results
-
 greywolf238 replied Sep 11, 2008
Adding those fib levels to the retracements are not the same as the fib extension levels.
New Mouteki Method...
- greywolf238 replied Aug 19, 2008
I took a short trade on the opening of the current candle, the previous candle failed to break thru the Intraday short, so i thought it was bearish, had a SL just above the Intraday Pivot, 4700, it took out my SL in no time..
Fibonacci Trading with Bobokus
- greywolf238 replied Aug 15, 2008
This is how i would draw my fibs, which is basically like your chart2, i would not take a long trade because even tho price is above the swing long, it's floating around between the intraday pivot and short and doesn't know which way to go yet. Just ...
Fibonacci Trading with Bobokus
- greywolf238 replied Aug 15, 2008
EU still looking bearish, last 2 candles came up and tested the swing pivot and it's still well below the intraday short. I took a short on the opening of the next candle. Bo Sherm, anyone, is this how you would have taken this trade. Thanks ...
Fibonacci Trading with Bobokus

- greywolf238 replied Aug 2, 2008
Is the Eur bull dead, who knows, here's a weekly chart, showing 3 red crows candlestick pattern. Check out this video saying the Eur has peaked and will hit 1.47ish by the year end. url Look for the Meg Browne video
EURUSD
- greywolf238 replied Jul 30, 2008
Came very close to bouncing of the 50 fib.
Trading Aussie Jacko Style

- greywolf238 replied Jul 22, 2008
To save a chart in MT4, just right click on it and choose Save As Picture, Active Chart. Then to upload to FF create a new post, scroll down and choose Manage Attachments, browse your computer and just upload it.
Signals From A Beginner
- greywolf238 replied Jul 17, 2008
While i'm bored watching the E/U, the aussie could have a wave break down, lets see if it makes it down to 9650, which is around the 50 fib.
Trading Aussie Jacko Style
- greywolf238 replied Jul 2, 2008
E/J is breaking waves up now, going to wait for a pullback and then go long, it's not to far from 168.00, overall trend is up so will be going with the trend.
zoopy's trading journal
- greywolf238 replied Jun 29, 2008
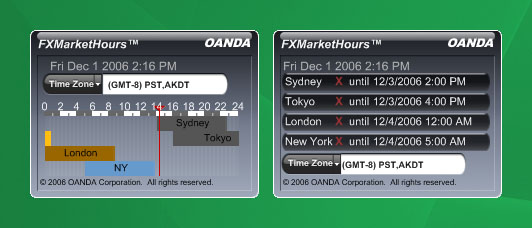
That's a nice little addon for Firefox. Here's another cool little tool, for those that can't remember the market hours, check out yahoo widgets. url
zoopy's trading journal
- greywolf238 replied Jun 26, 2008
In these 2 charts long term trend is up, there is a pull back, doesnt look like enough momentum to break the wave down. I'm not trading these, just practicing.
zoopy's trading journal
- greywolf238 replied Jun 26, 2008
What do you think guys, good time to go long on E/GB looks like a pullback on the H4 chart, and it may be heading back up.
zoopy's trading journal
- greywolf238 replied Jun 24, 2008
Here's what happen to the EU last time we had a FOMC statement on April 30 @ 2:15 it shot up just over a 100 pips. Edit: I just looked up the March Fomc that one had a spike down.. lol
zoopy's trading journal
- greywolf238 replied Jun 23, 2008
Here's a H4 chart of E/G long term overall trend is up, let's see if it breaks a wave up.
zoopy's trading journal
- greywolf238 replied Jun 19, 2008
I'm just waiting for EU to make up it's mind which way it wants to go..
zoopy's trading journal

- greywolf238 replied Jun 19, 2008
Here's a 4 hour chart of the EU there is a wave collapse but it could go either way, looks like it starting to point back up, waiting for the close of this 4 hour candle to get some direction.
zoopy's trading journal
- greywolf238 replied Jun 18, 2008
Here's a chart of the EJ H4 possible wave break down, i would be careful going short if it does break because the long term trend is up.
zoopy's trading journal
- greywolf238 replied Jun 13, 2008
Well the market has closed and the EU did have a wave break on the weekly chart and is below 5400. At what point would you start shorting this? would you wait for further confirmation of bearish movement..
zoopy's trading journal