- Search Forex Factory
- 9 Results
-
 degoor1975 replied Aug 2, 2020
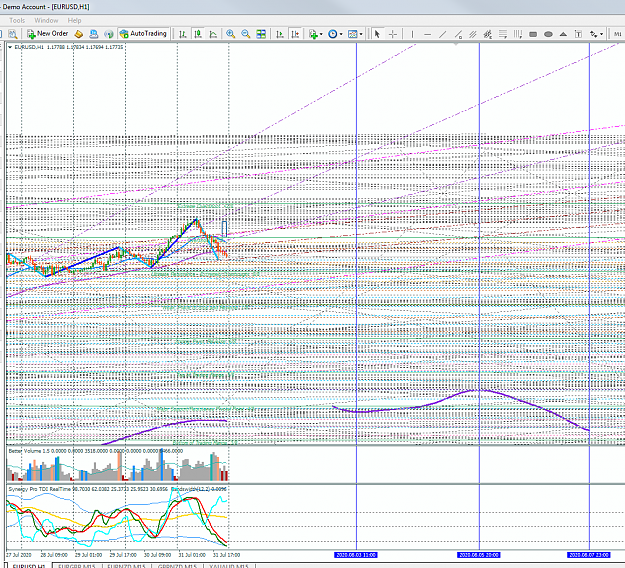
Here is the projected Fourier line for the 8/3/2020 week. image The price should go down about 20 pips from the start till 8/3/2020 11:00, then should go up about 80 pips at around 8/5/2020 20:00 and after that straight down for approximately 140 ...
Planetary Cycles Trading (EUR/USD)
- degoor1975 replied Jul 26, 2020
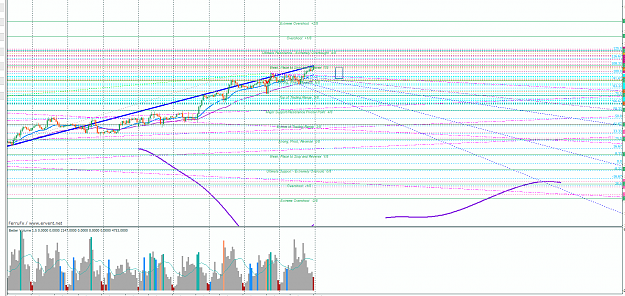
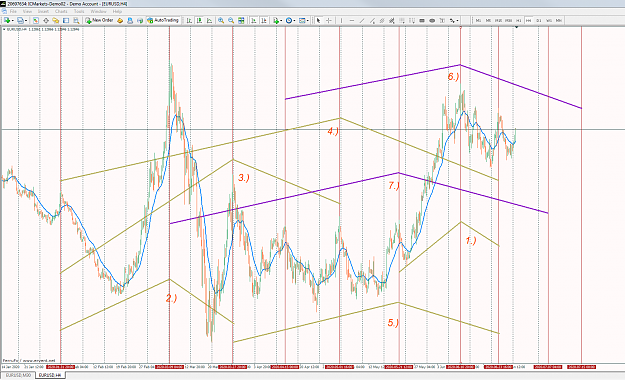
Here is my Fourier projection for the next week on EURUSD: image According to it the euro should be going even higher. It would be flat on 7/27/2020 and at around 7/28/2020 9:00 it should start to go up till 7/31/2020 11:00 when it seems it would ...
Planetary Cycles Trading (EUR/USD)
- degoor1975 replied Jul 22, 2020
Yesterday, 7/21/2020 was a big move day for all forex markets. We need to consider what prompted the thing. Firstly we have a new moon. That gives a burst of new energy and creates greater moves. Both Venus and Mercury are behind the Sun which might ...
Planetary Cycles Trading (EUR/USD)
- degoor1975 replied Jul 19, 2020
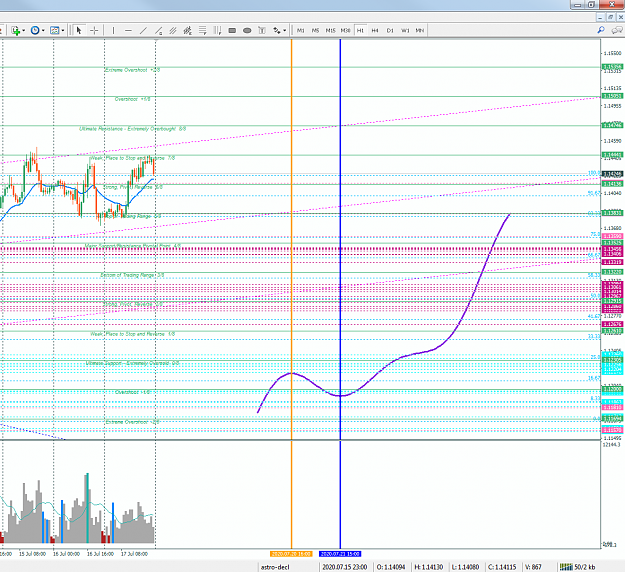
Starting this week I will be using a new price projection method based on Fourier transform. I have to forewarn you that even though the projection is based on cycles those aren't planetary cycles. Still I hope this would be relevant to the ...
Planetary Cycles Trading (EUR/USD)
- degoor1975 replied Jul 14, 2020
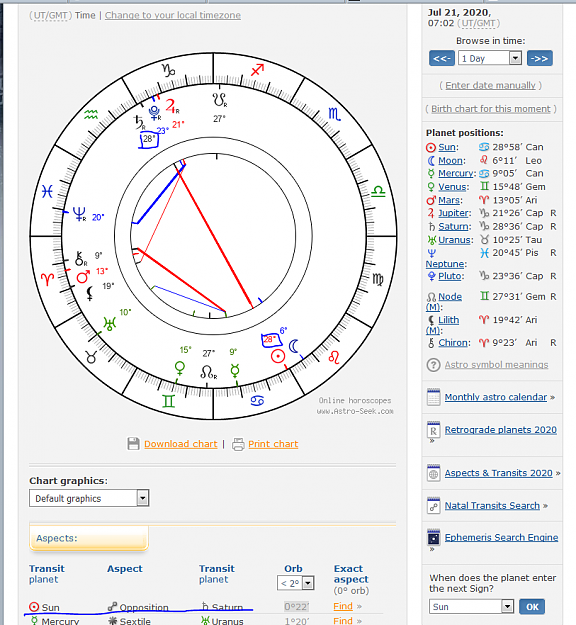
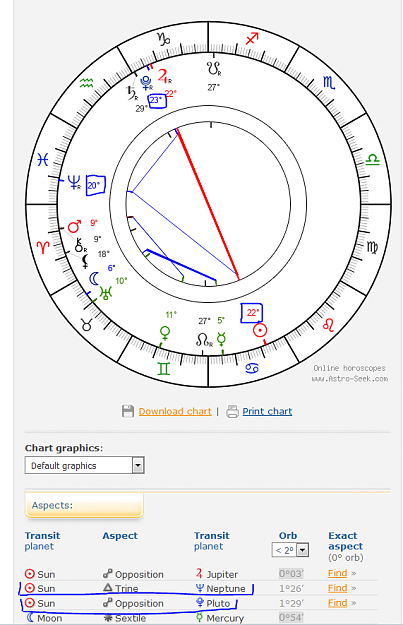
I read somewhere that the GBPUSD is moved when a planet makes aspects to both Neptune (USD significator) and Pluto (GBP significator). So we have the following astro chart now: image On the astro chart you can see the Sun making trine (120 degrees ...
Planetary Cycles Trading (EUR/USD)
- degoor1975 replied Jul 6, 2020
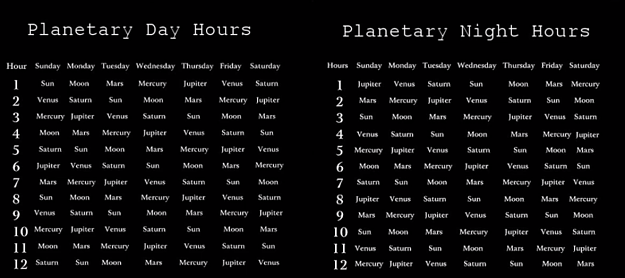
A little gift so that I can repay some part of my debt towards the community. I day trade so it is very important for me to know how the astrological influences change during the day. I found something really simple that gives some good trading ...
Planetary Cycles Trading (EUR/USD)
- degoor1975 replied Jun 29, 2020
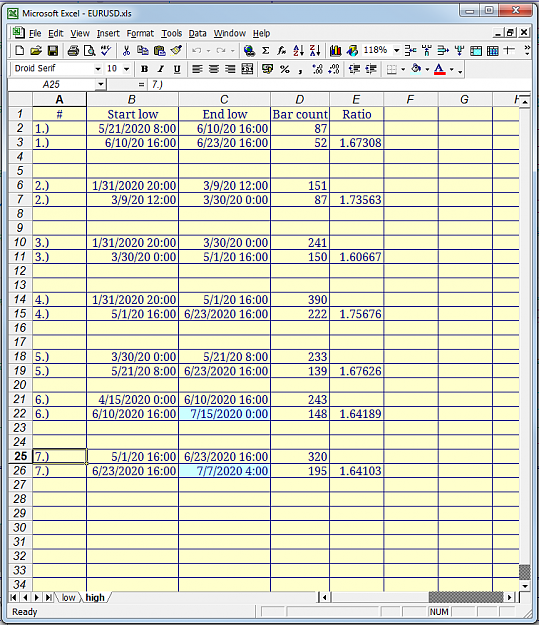
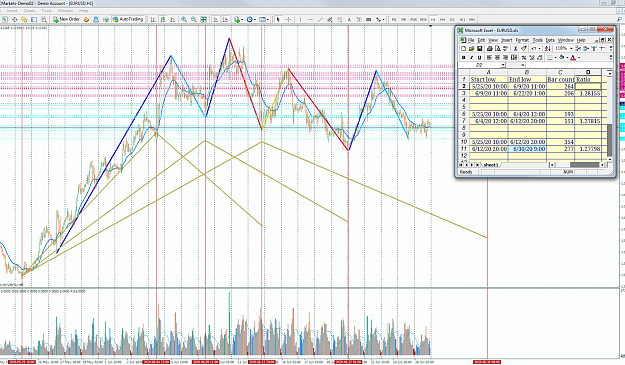
I decided to try the same approach for the highs but I had to use 4H chart (due to the big run up from 05/18 till 06/05). So here what I have got: image And here are the calculations: not as good as the previous ones but I did my best
Planetary Cycles Trading (EUR/USD) image ...
- degoor1975 replied Jun 28, 2020
Started to read "The Spiral Calendar and Its Effects on Financial Markets" by Christopher L. Carolan. It is stated there that there is a harmonic link between major markets top and bottoms. More specifically the time interval from the latest low to ...
Planetary Cycles Trading (EUR/USD)
- degoor1975 replied Jun 16, 2020
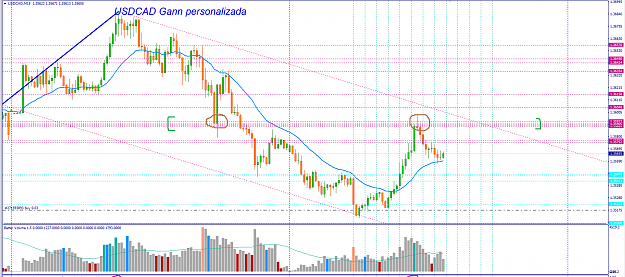
Started to make those calculations: I just can't believe my eyes! image Look at the USDCAD, 15min chart: There is a HUGE resistance [5 planets harmonic lines there] between 1.35885 and 1.35927. Surprise, surprise - the price went down after ...
Planetary Cycles Trading (EUR/USD)
- Posts by Member Search: 'degoor1975'