- Search Forex Factory
- 88 Results
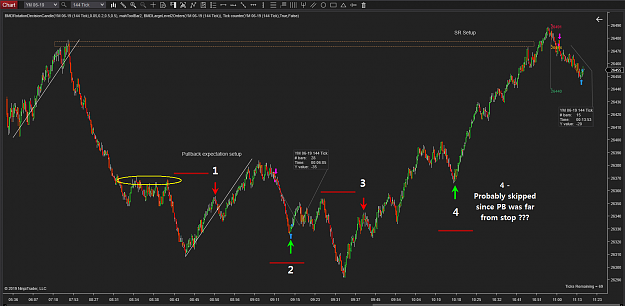
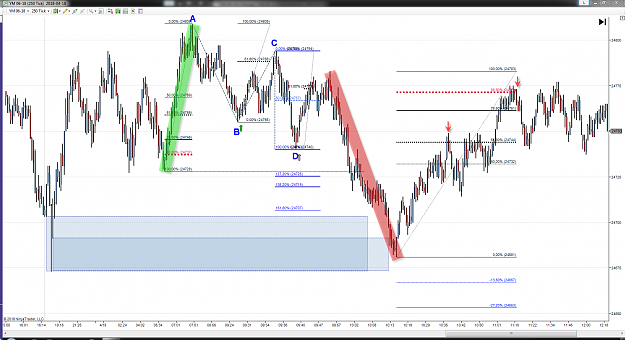
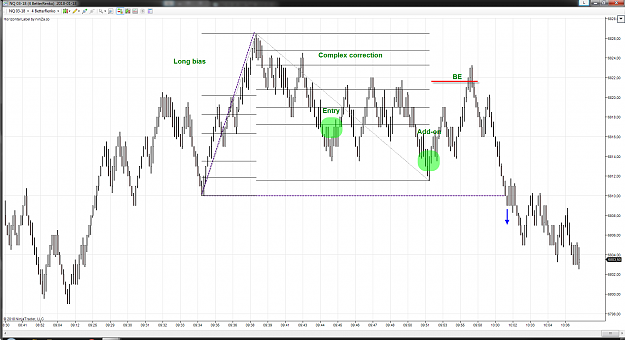
- crixus replied Apr 26, 2019
I did mark this chart using another member picture. I think these notes reflect Damian's rules. Would you have took the 4th trade given the losses 1-2-3? Perso, i think this is the main reason people modify or add to this system as at times it ...
Ratios & Harmonics: a Different Way to Trade
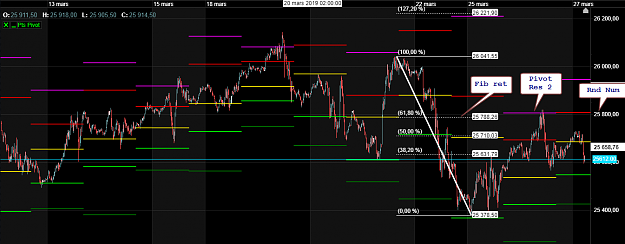
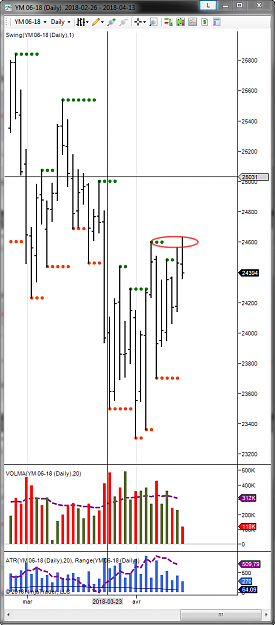
- crixus replied Mar 27, 2019
From my perspective, medium term price looked bearish" Here are some confluences you could have conjured: image
Ratios & Harmonics: a Different Way to Trade
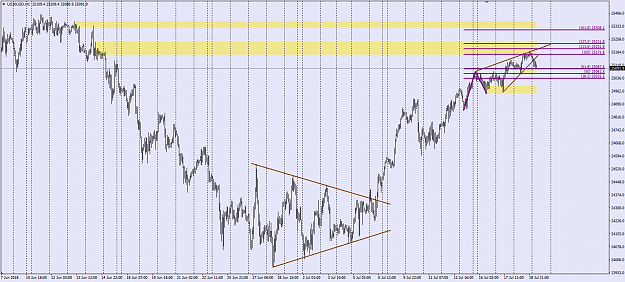
- crixus replied Jul 19, 2018
I can see this on YM (CFD Oanda): image
Ratios & Harmonics: a Different Way to Trade
- crixus replied Jun 1, 2018
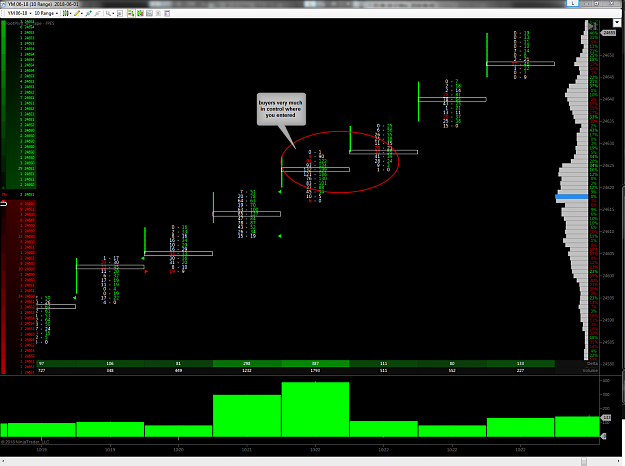
Without playing God, price action reading includes taking into account strength and weakness. The move up to where you took you entry was very strong and very imbalanced in favor of the bulls. image
Ratios & Harmonics: a Different Way to Trade
- crixus replied May 26, 2018
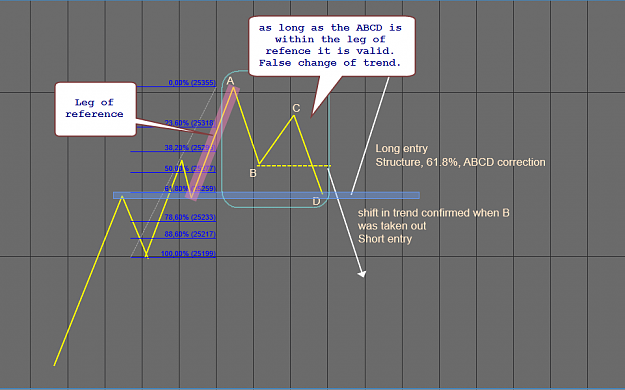
When i asked this question before i got something along these lines as explanation: image
Ratios & Harmonics: a Different Way to Trade
- crixus replied May 25, 2018
That's one of the condition that we often see when price could be considered OB/OS Usually, you'll see more volume at the end of a move in the OB/OS territories. TO be considered OB/OS i need to see price move with conviction in one direction ...
Ratios & Harmonics: a Different Way to Trade
- crixus replied May 19, 2018
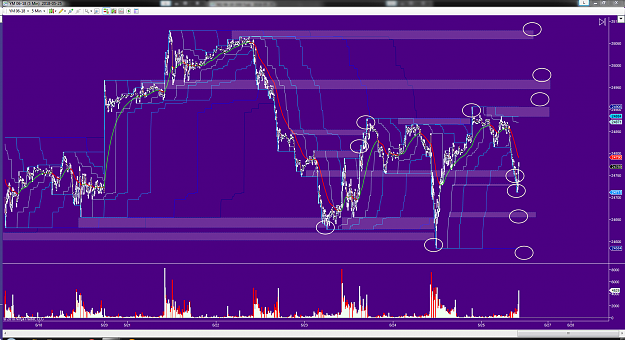
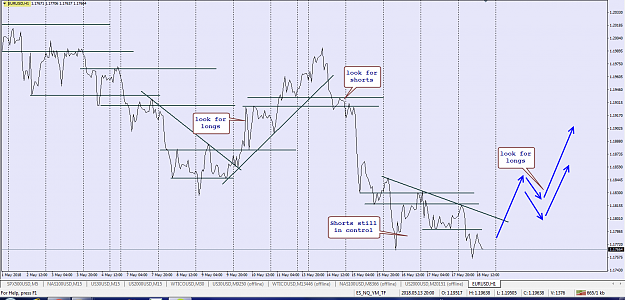
What about simple price action principles. Break of TL or structure after a break of a TL. It seems much easier and no need to predict where price might reverse. Anyway, in a down trend like we are seeing on the EURO, any test of a prior swing low ...
Ratios & Harmonics: a Different Way to Trade
- crixus replied Apr 18, 2018
Was seeing it like you today: image
Ratios & Harmonics: a Different Way to Trade
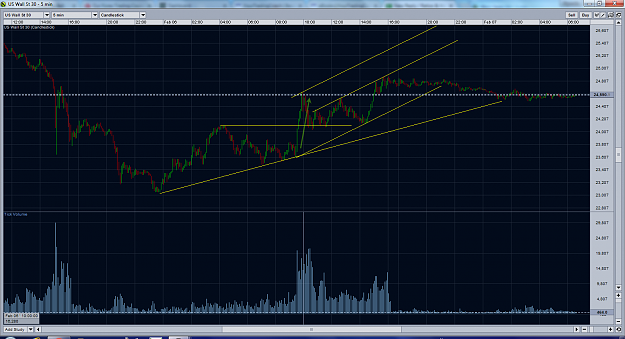
- crixus replied Apr 13, 2018
My game plan today was watching for a failure at the high since most breakouts fail specially that the last two days volume was declining: image
Ratios & Harmonics: a Different Way to Trade
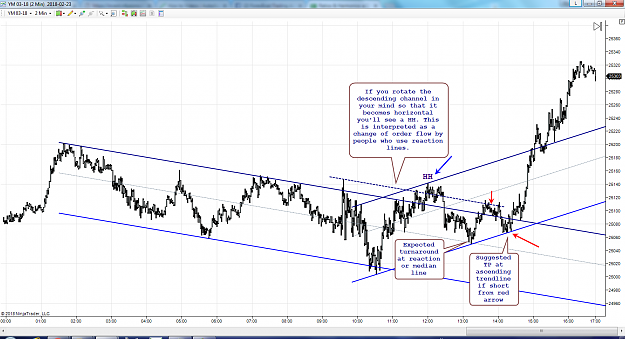
- crixus replied Feb 24, 2018
Hi bmdenton23, Here is a different perspective on your short using channels also called action/reaction lines. If you want to know more about this way of representing the context look for Medianline and Timothy Morge. Using this representation, your ...
Ratios & Harmonics: a Different Way to Trade
- crixus replied Feb 7, 2018
It is Damian who played against expectation: image
Ratios & Harmonics: a Different Way to Trade
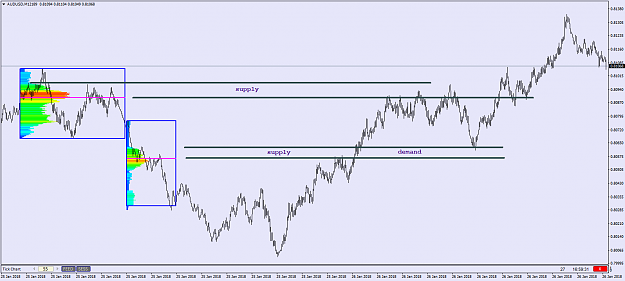
- crixus replied Jan 18, 2018
Is the analysis valid on the chart? The blue arrow marks the change of behavior. image
Ratios & Harmonics: a Different Way to Trade
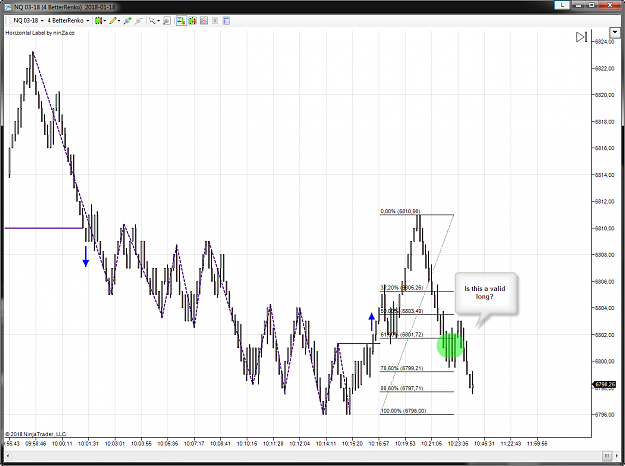
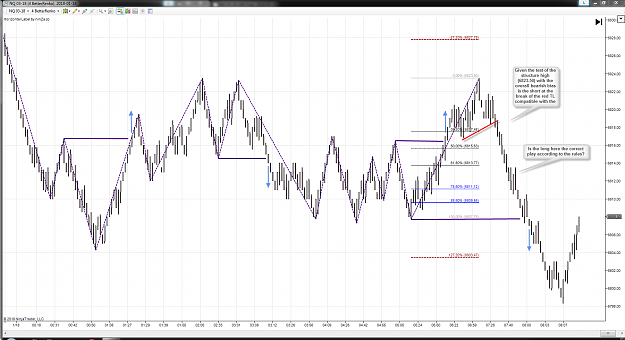
- crixus replied Jan 18, 2018
Questions for you guys... Is a short at the break of the red TL compatible with MrPip's system? And is the long valid?
Ratios & Harmonics: a Different Way to Trade
- crixus replied Sep 25, 2017
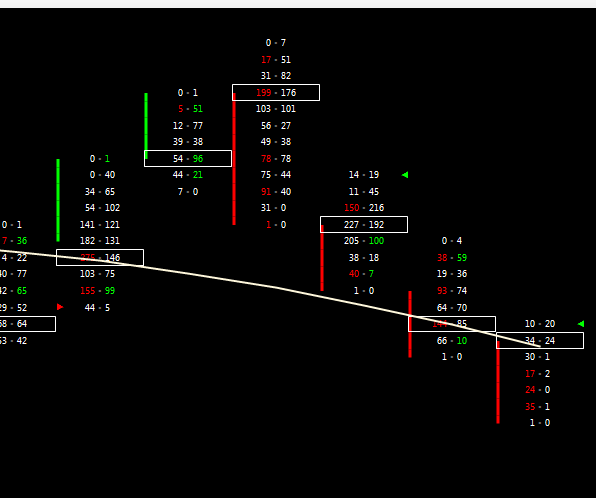
Just to give you an order of magnitude of what you can expect. a 200 Lots would have slippage on YM. Here is the number of lots traded at around 10:25 EDT. image
Ratios & Harmonics: a Different Way to Trade
- crixus replied Aug 17, 2017
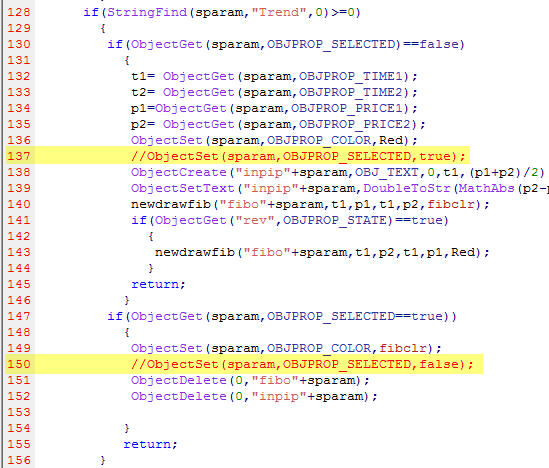
Thank you very much, the compilation of the code did not change anything. However, i made a little modification and now it just rocks. I commented these two lines in yellow (137, 150): image By chance you shared your code otherwise i would have ...
Ratios & Harmonics: a Different Way to Trade
- crixus replied Aug 14, 2017
@parviz1953 Your tool works just great. However, i would have liked to be able to turn ON/OFF the display of the Fib values for the line on which i click only but not hide all the other fib values for the other legs. In many cases, i like to see the ...
Ratios & Harmonics: a Different Way to Trade
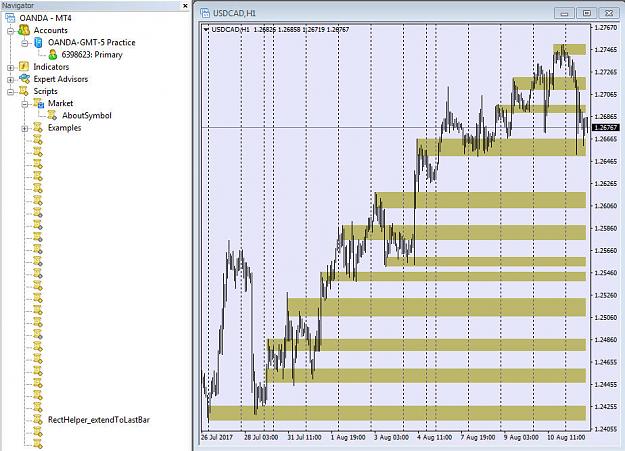
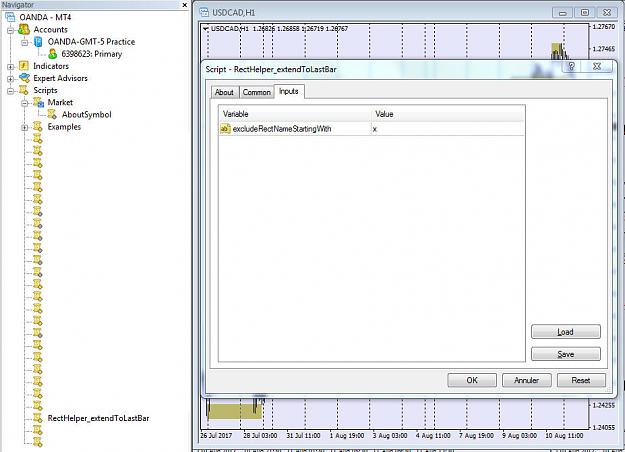
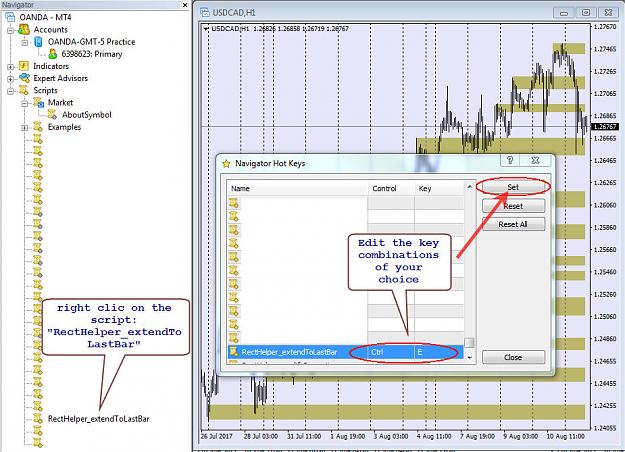
- crixus replied Aug 13, 2017
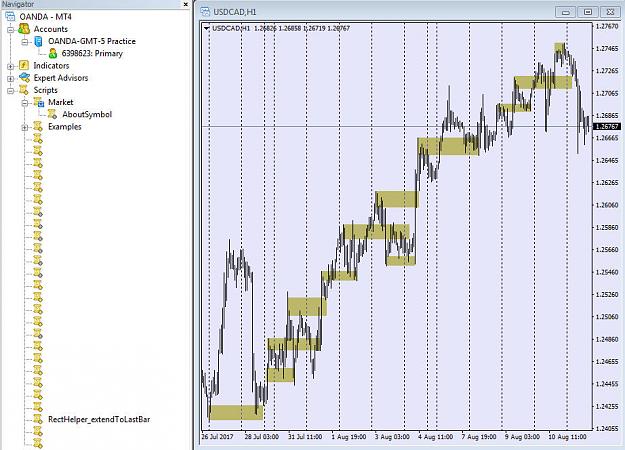
Thank you very much. In the same spirit of sharing. I did this script last year which allows me to extend all rectangles to the right of the chart. Since it is a script, i also have assigned a key combination (CTRL + E) in order to execute it in an ...
Ratios & Harmonics: a Different Way to Trade
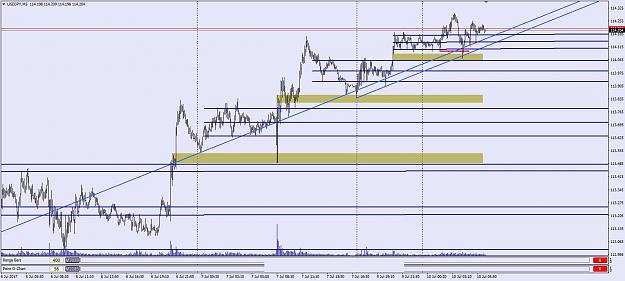
- crixus replied Jul 10, 2017
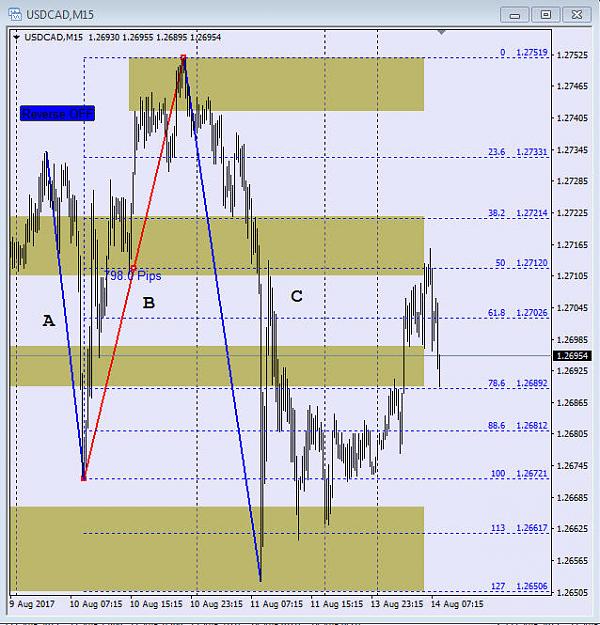
Is going againts the trend or strong hand an error in your book? image
Ratios & Harmonics: a Different Way to Trade