- Search Forex Factory
- 30 Results
- Simon73 replied Dec 12, 2013
My view: There are two elipsis in the chart. The first was in September. There was a big chance of tapering, and the market was USD long and CHF short. When FED did not taper, we could the CHF short positions liquidations for 15 days. It pushes the ...
EUR/CHF
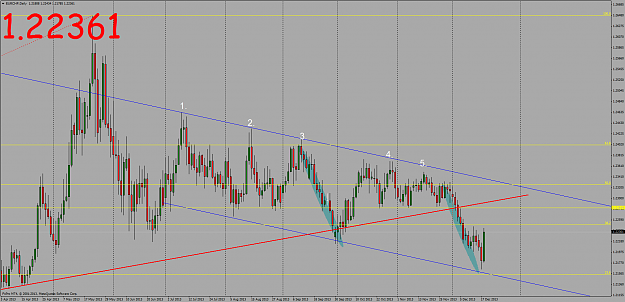
- Simon73 replied Dec 3, 2013
we have reached two very strong support lines at 1,2275. It should be bounce from here. The range is only 75 pips!. When will it break out? If this bounce is not enough to break out 1,2350, we need to go lower for some fresh, strong buyers, who ...
EUR/CHF
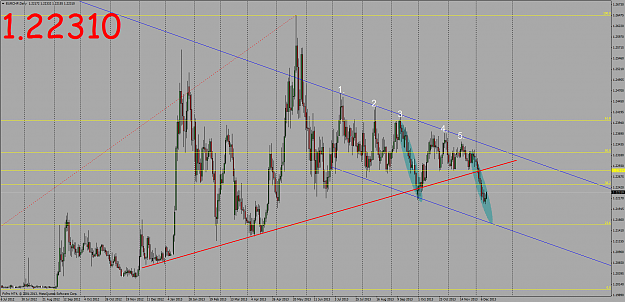
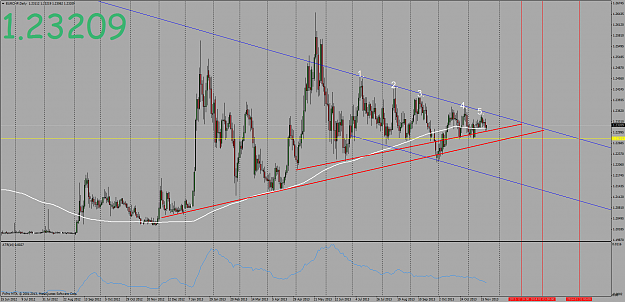
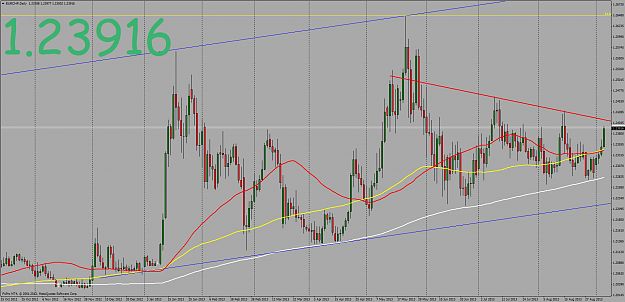
- Simon73 replied Nov 21, 2013
We have a clear trendline which is work as a cap for the upside move. Now it is about 1,2353. In the downside there are two trendlines and we have the 1,2280 strong level. The two trendlines now:1,2303 and 1,2270. And we have the old 200 DMA which ...
EUR/CHF
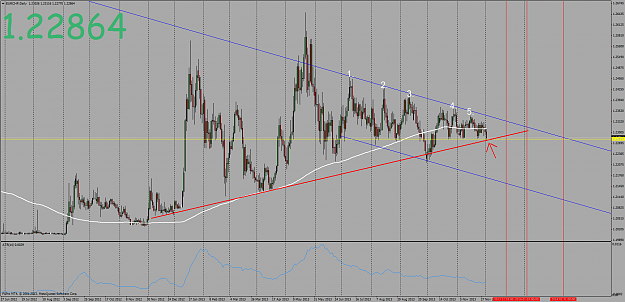
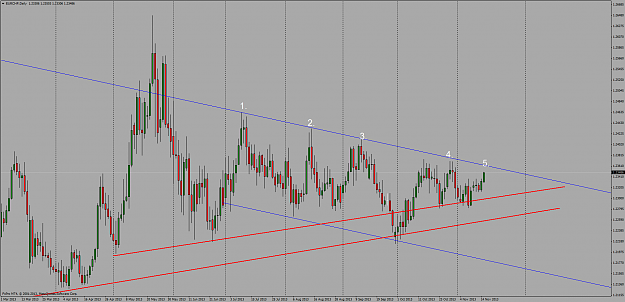
- Simon73 replied Nov 15, 2013
5.th attempt to break out the big trend line. If it could break anytime, opens the way for 1,25-1,26 or 1,2750 Now the trendline resistance is 1,2362
EUR/CHF
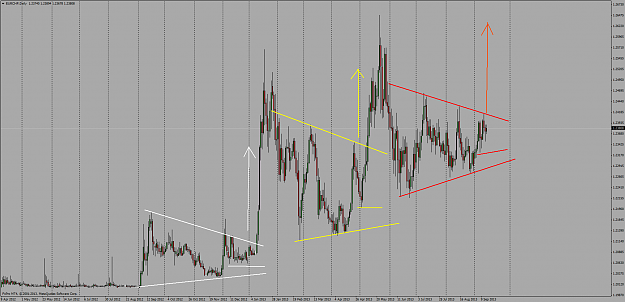
- Simon73 replied Sep 13, 2013
Looks like EC loves triangles: In every triangle before the breakout the last low was not tauch the lower trendline, like now. I think we only a few days to break out. Next week FED and SNB meeting.
EUR/CHF
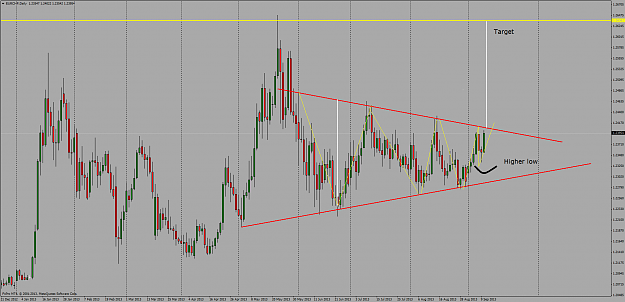
- Simon73 replied Sep 10, 2013
My Chart: We have a clear triangle on Daily chart, with 3 upper line touch and 3 lower line touch point. So the situation is ideal for break out. The yellow line is target price calculated from the triangle if we break out to north. My experienc: if ...
EUR/CHF
- Simon73 replied Sep 5, 2013
3 things which could trigger the break out tomorrow: - swiss datas: CPI and SNB reserves - 2 year anniversity of CAP (psihologically better to close shorts in this day) - NFP and Unemployment rate Technically a lot of thing shows bullish on daily: - ...
EUR/CHF
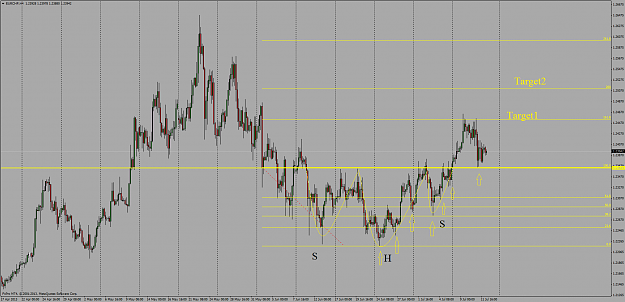
- Simon73 replied Jul 12, 2013
A little technical analisys: In h4 EC formed a H&S formation with 1,2365 neckline. It was a very strong resistance, but finally could broke it. The first target was 1,2455. After we get the first target, we tested the neckline. At first time it ...
EUR/CHF
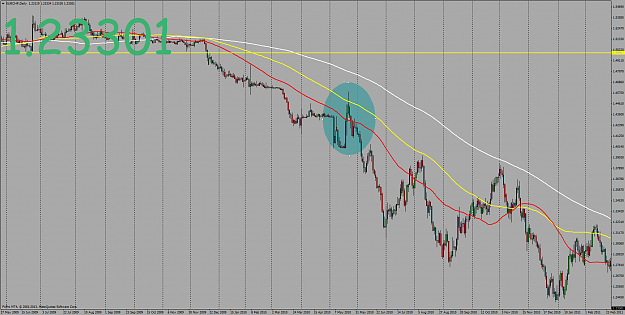
- Simon73 replied Jul 4, 2013
When i say a lot of tool, i mean some not normal tool. Verbal is one of this tool, but this has not too much effect. I attach one chart from 2010. There was a big level 1,5000 which was defended by the SNB in 2009. At the end of 2009 SNB gave up ...
EUR/CHF
- Simon73 replied Jul 2, 2013
Yes it is very strong level. And this is the 50MA on daily chart. We are above the 100 and 200 MA, we need to break out the 50 MA. In the past year every time when the price could go up all the 3 daily MA, there were some rally. The 200 and 100 MA ...
EUR/CHF
- Simon73 replied Jun 20, 2013
This is because the power of the trend. CHF strengthening is very strong trend. It takes times (years) to change. Like the big ocean ship if you want to change its direction, first you need to slow it, stop it, turn it, and start it. Look the ...
EUR/CHF
- Simon73 replied Jun 17, 2013
Finally we are trying to break up above 1.2330. If it is success we could brake up the decreasing channel in h4
EUR/CHF

- Simon73 replied Jun 6, 2013
I think these CHF weakness was because of USD rally last weeks. The reason of the USD rally is the tappering talking. In 2009 march FED started QE1 which was the main reason to weaken the USD. Ahter that we had QE2, and QE3. These days there is ...
EUR/CHF
- Simon73 replied May 9, 2013
Till 2009 a lot of money went to safe haven: JPY, CHF, Gold As economy getting better this money goes back to USD, EUR etc. Firstly the JPY collapsed this year: Seondly Glod dropped: One day CHF will start to drop. May be this is that day...
EUR/CHF
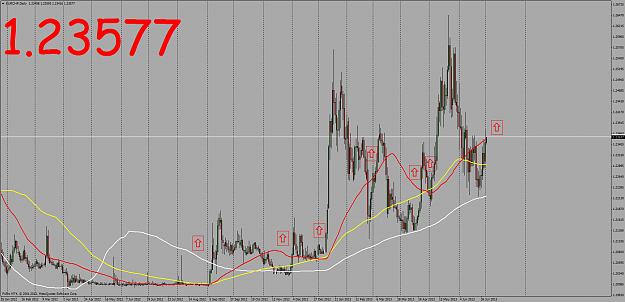
- Simon73 replied Apr 19, 2013
If we see the last two breakout, there are some common things: - consolidating for 20-50 days with smaller ATR (accumulation phase) - strong support level (50,100, 200 DAY MA) - Local minimum in the ATR - Short covering sentiment Now we have: - ...
EUR/CHF
- Simon73 replied Apr 18, 2013
Till 2012. sept the 200 dayMA is working as strong support (white line) Now it is 1,2135, and growing day by day about 1pip/day. The 100 dayMA is resistance now (yellow line). This is 1,2217
EUR/CHF
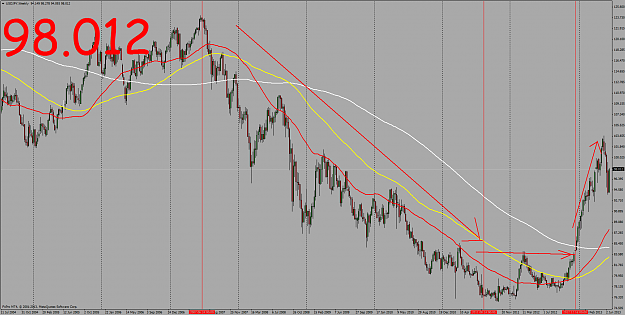
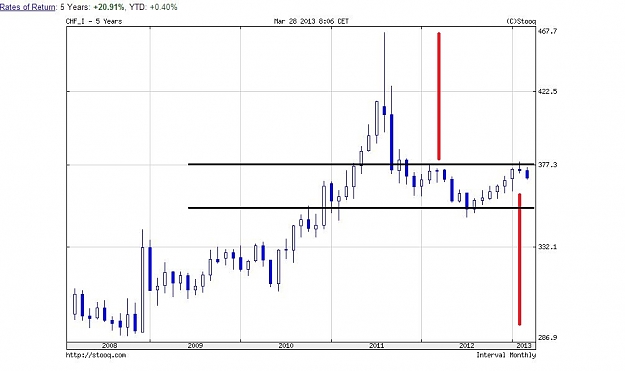
- Simon73 replied Mar 28, 2013
I agree with you. Additionally if you see the bigger picture: In the past 10 years there was strong rally in the CHF. In 2011 there was a big spike, which ended with the 1,20 EUR/CHF peg. The last two yeas was a consolitadion after the spike. In the ...
EUR/CHF

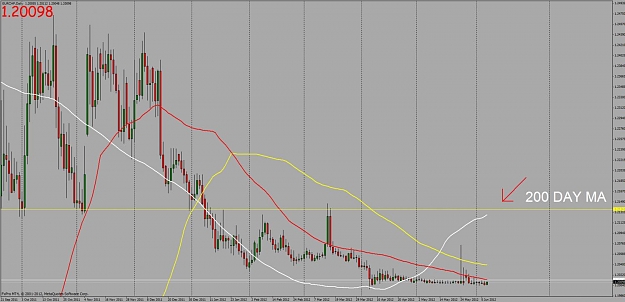
- Simon73 replied Jun 7, 2012
200 DAY MA — Interesting thing: The 200 DAY MA is raising because the days under 1.2 price is dont counting to the MA. There is only 2 days left. On Monday it will stop raising. Now the 200 DAY MA is 1.2136, on Monday it will be about 1.2143. ...
EUR/CHF