- Search Forex Factory
- 16 Results (1 Thread , 15 Replies )
-
 Mac712 replied Oct 15, 2022
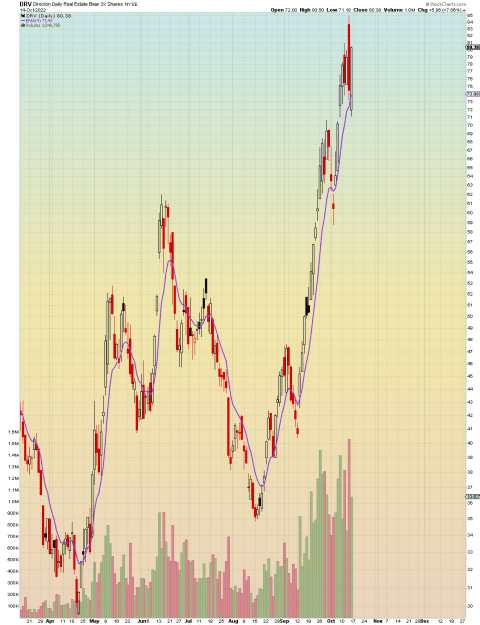
DRV as a play of higher rates killing the housing market due to the Fed trying to stop Inflation. image
How to use the 9/20 EMA setup effectively
- Mac712 replied Jan 12, 2022
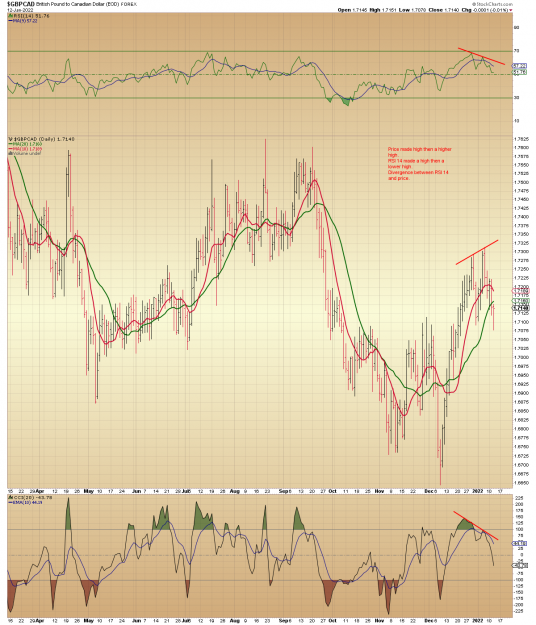
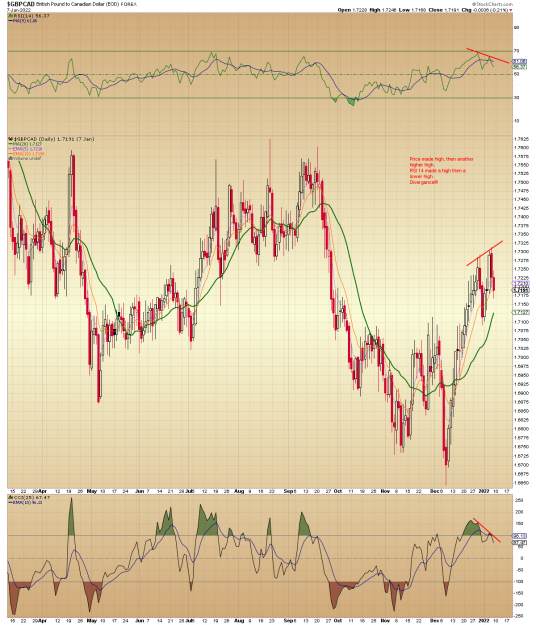
RSI 14 and price divergence is the key. Look at any chart and you see RSI 14 and price divergence you can count on odds that price if fixing to change direction. And don't hate the messenger. image
Daily Chart w/ 10sma
- Mac712 replied Jan 11, 2022
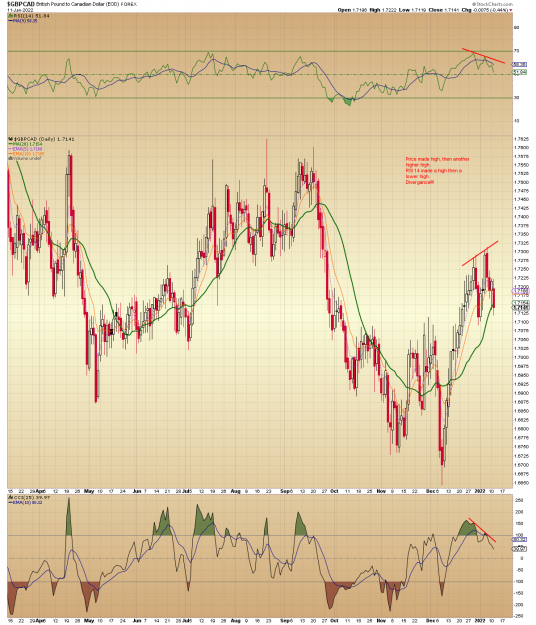
After 2 days here's a updated chart for GBPCAD . Divergence of Price VS Rsi 14 comes into play. I'm not trying to hi-jack this thread but 10 day sma is too slow for my taste. image
Daily Chart w/ 10sma
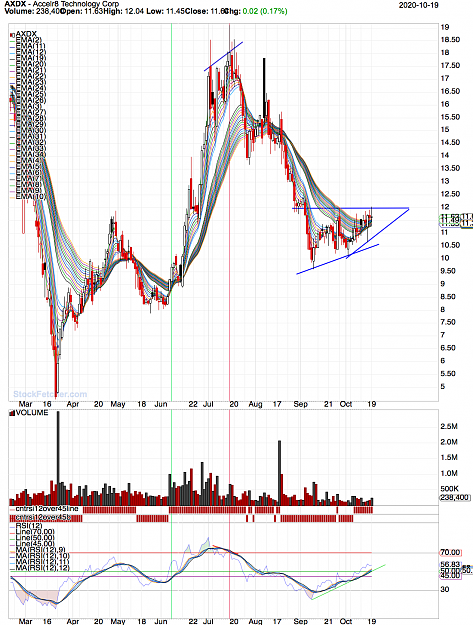
- Mac712 replied Oct 19, 2020
------------------------- Yes I'm using RSI on my charts- A lot of people use RSI 14 and I look at RSI 12 as a momentum indicator as in 70 / 30 line being strength of the momentum and not over brought or over sold areas. The RSI 50 or even the 45 ...
Guppy's Multi-Moving Average (GMMA)
- Mac712 replied Aug 27, 2020
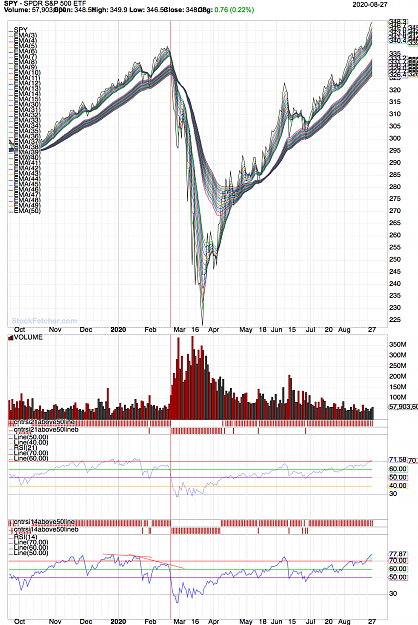
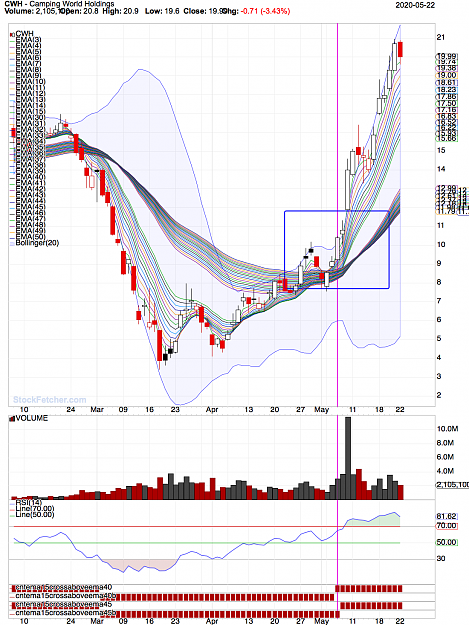
RSI 14 at historical over brought levels. Due for a pullback. image
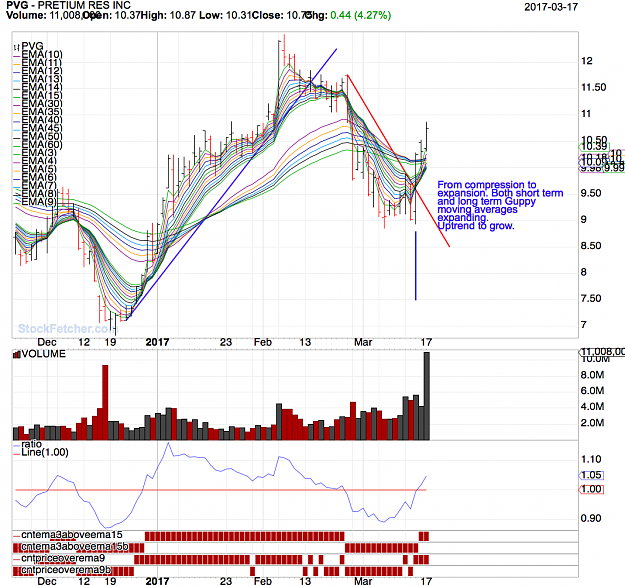
Guppy's Multi-Moving Average (GMMA)
- Mac712 replied May 26, 2020
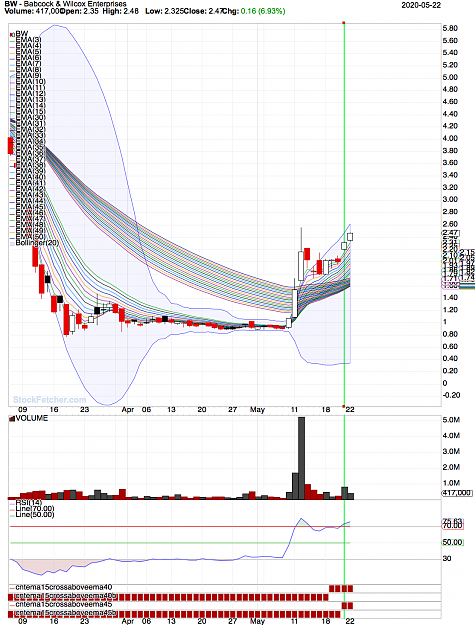
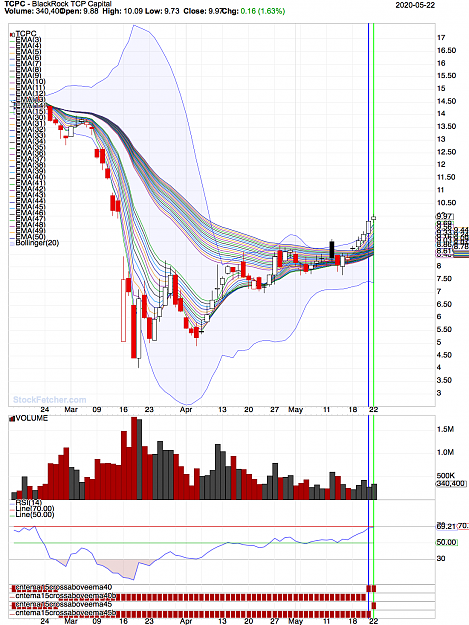
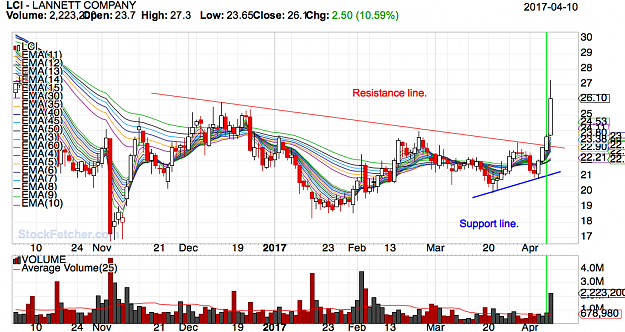
Nice setup for tomorrow. EMA 15 cross above both EMA 40 and 45. Traders group just about to clear Investor's group. Investors starting to squeeze and rollover. image
Guppy Multiple Moving AverAge,GMMA
- Mac712 replied Nov 7, 2017
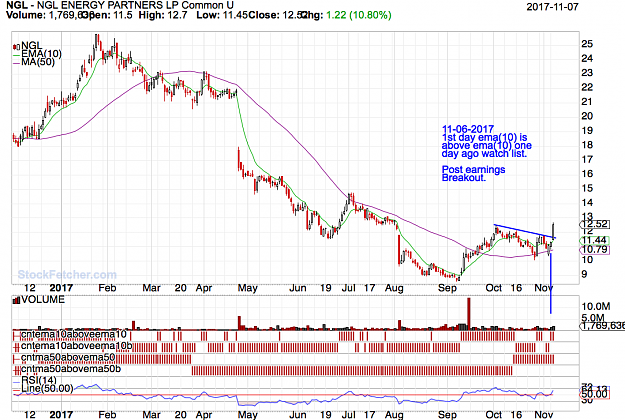
Trading no more than 4 or 5 stocks at a time. Trading FOREX is too much work for a small profit. Daily charts with interday breakouts Price crossed above EMA(10) (remount of a uptrend), then price must have a next day follow through. Price opens on ...
Do you trade one or multiple instruments?
- Mac712 replied Apr 11, 2017
In Daryl Guppy's "Trend trading" he more or less days says quit using those worthless Indicators. I tend to agree.
A "new" simple system based on MA
- Mac712 replied Mar 18, 2017
Throw out all those wild goose chase Indicator's - Use Guppy MMA's image
Predict breakouts & trend reversals using macd/bb%
- Mac712 replied Dec 24, 2016
as opposed to following lagging indicators. To me its price action and one moving average on any time frame . Lets say ema(13) and price. Like a rubber band price will go back and forth from that average. If price action doesn't change the direction ...
Your top 3 indicators

- Daily chart/price/one moving averageStarted Dec 23, 2016|Trading Discussion|0 replies

Daily chart . It can be a simple as price and one moving average The ema(13) . Price is above or ...
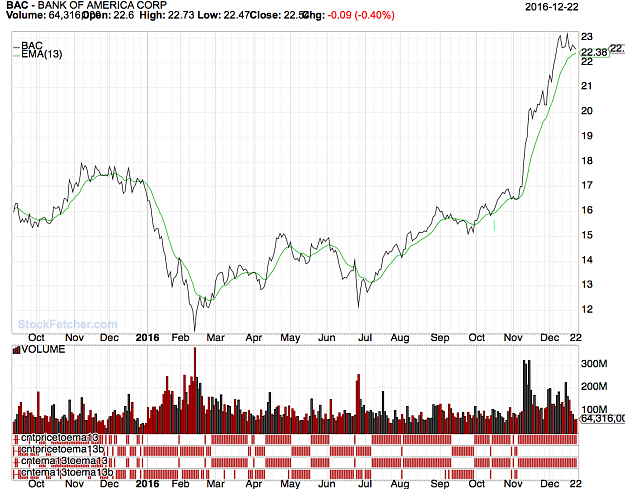
- Mac712 replied Oct 30, 2016
On daily chart I use wma(4) ema(13) ma(50) and average volume 25 day line. watch the volume on up days vs the volume on down days. Take a look at BAC chart. The ema(13) is the swing trade average and wma(4) as points to get in one the 1st day up. ...
Predict breakouts & trend reversals using macd/bb%

- Posts by Member Search: 'Mac712'