- Search Forex Factory
- 15 Results (1 Thread , 14 Replies )
-
 Indyfx replied Sep 17, 2010
Entries — Here is my approach to this morning. As you will see from the 5 min chart there was a range with the bottom at 5690. What I was looking for was a conclusive break of the upper or lower levels. You can see the bar at 11.05 broke ...
Cable Update (GBPUSD)
- Adjusting the colours of bar range indicator at predetermined valuesStarted Sep 17, 2010|Platform Tech|4 replies

Hi there, I would be very grateful if anyone could help me with modifying this indicator This ...
- Indyfx replied Aug 11, 2010
Ass levels — Hi Cloggie, Here is my attempt at finding the Ass levels. As you have published the ones up to 6237 it made sense to try to find the ones above that level which I have shown in blue. I think that the 416 and 639 are about right ...
Cable Update (GBPUSD)
- Indyfx replied Jul 1, 2010
Update — As predicted earlier close to reaching area of confluence
EURUSD
- Indyfx replied Jul 1, 2010
My view is that we are heading to about 340 -52. I see this as an ABC correction. At that price range we have the following: Weekly pivot point 4hr downward trend line 4hr upwards trend line 100 fib extension The price action today looks quite ...
EURUSD
- Indyfx replied Apr 9, 2010
Hi Sangmane, I am sorry it was not clear and I really appreciate you trying to help. This is what I am looking to do if you look at the attached chart showing GBP USD for today. Yesterday the Average True Range was 149 pips (using a 14 day ATR). I ...
Adjustable daily range price box indicator
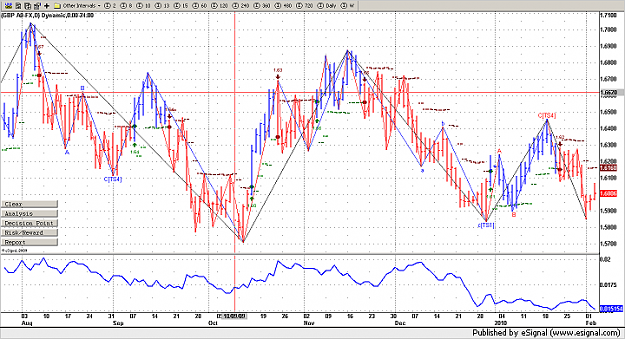
- Indyfx replied Feb 3, 2010
Olpip Here is the 14 day ATR that I posted earlier based upon the daily chart. The key thing as we know has been the fall since mid December and the lack of recovery since. Here hoping for bigger range days !!
0400-0700 GMT Breakout Strategy

- Indyfx replied Feb 3, 2010
Daily ATR still at lows — Another breakeven trade sticking to the rules. Regrettably no sign of improved volatility
0400-0700 GMT Breakout Strategy
- Indyfx replied Dec 2, 2009
Dear Bob, Sorry it was not clear. In a trend you get swing lows and swing highs. If you take this morning as an example. The slopes were set up for a short trade. Now normally at the time that the box ends (07.15 GMT) the price is nowhere near the ...
0400-0700 GMT Breakout Strategy
- Indyfx replied Dec 2, 2009
Dear Bob, It is not a slope that I use on the 1 min chart. I have a different charting system and I have tried to replicate the pivot feature in Metatrader. So if the price is trending at 07.15am GMT as it was this morning you would wait for a pivot ...
0400-0700 GMT Breakout Strategy
- Indyfx replied Nov 9, 2009
Hi Pierre, I think that your 12, 3, 0 line must have some smoothing built into it because here is mind which looks quite different from your. Thanks for all your help it is much appreciated
7am-9am Big Dog USD Breakout Strategy

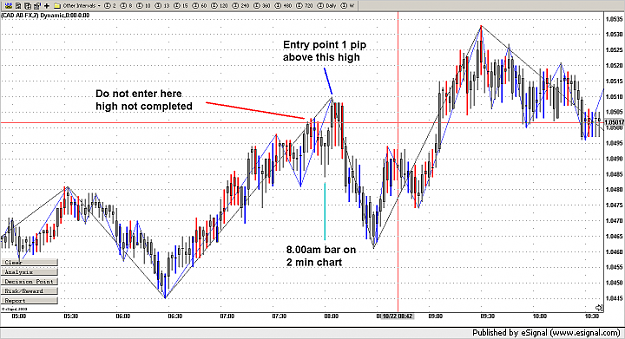
- Indyfx replied Nov 8, 2009
Hi Gangsta, I have now backtested USD CAD to include September as well as October based upon the London opening and here is a strategy that works. Unfortunately I have had to change the criteria for the Slope Direction to make it work. However in ...
7am-9am Big Dog USD Breakout Strategy
- Posts by Member Search: 'Indyfx'