- Search Forex Factory
- 104 Results
- Fx93 replied Mar 28, 2012
Thanks for making me learn about range bars, they do seem to make technical trading clearer. Have you guys estimated how they compare to time charts. For example, a 15 pip chart seems close to the hourly to me, perhaps a bit less. Anyway, I was ...
Islander and Medici trade the European open
- Fx93 replied Mar 27, 2012
A guy named Tony Lipton programmed the CII for thinkorswim that I use. It looks to be correct. The thing I wish to convey is that one can substitute the two "RSIWilder" parts of it for any of one's favorite divergence indicators. declare lower; ...
Islander and Medici trade the European open
- Fx93 replied Mar 22, 2012
Hi Vantage, I read your currency meter thread yesterday, as I am making a study of it, and saw your lh hl strategy. I'm going to be studying this thread. One thing that strikes me about your method is that you could look for hidden bearish or ...
Higher low, lower high system
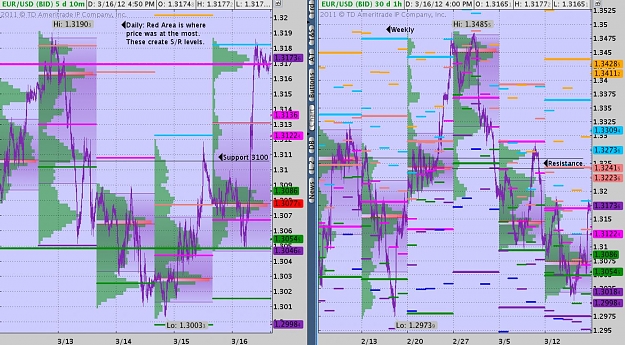
- Fx93 replied Mar 18, 2012
Here are some observations from the TPO Profile study. Seeing as we shot straight up last Friday, we may get a retrace to 1.3136 to 1.3100 (price usually retraces to fill the thin green lines). However, it seems like we will go to at least 1.3241 ...
EURUSD
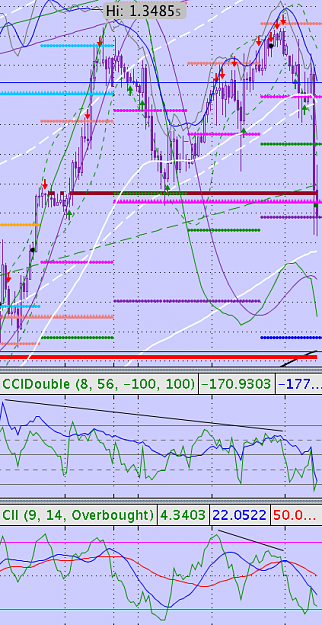
- Fx93 replied Mar 11, 2012
Here's the divergence in the recent upmove to 1.3290 on the 2M. The solid grey lines are the +/- 6 level, while the dotted lines are the +/- 3 level. One waits for it to cross the +/- 6 level as the setup, then starts shorting it here when price is ...
EURUSD
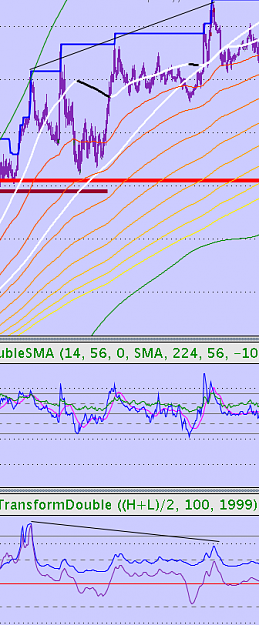
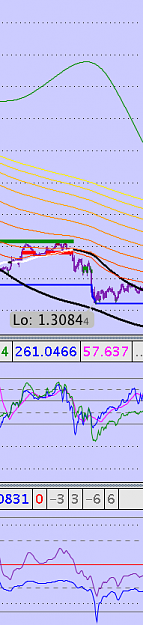
- Fx93 replied Mar 11, 2012
Anyone use these Fisher transform divergences? I like how they produce sharp peaks/troughs. I find there is almost always two or more 1999 period Fisher transform peaks/troughs before a downtrend or uptrend is over. This is on the 2M. Usually there ...
EURUSD
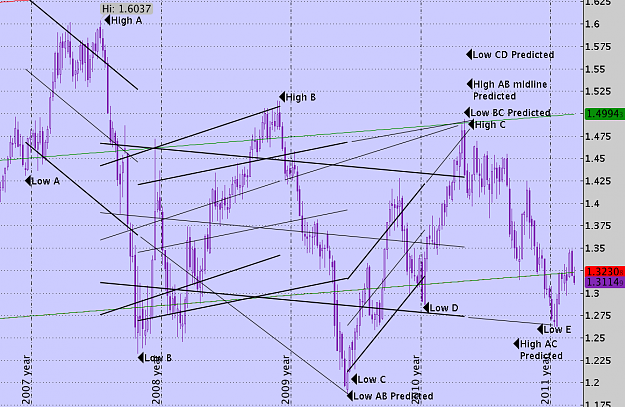
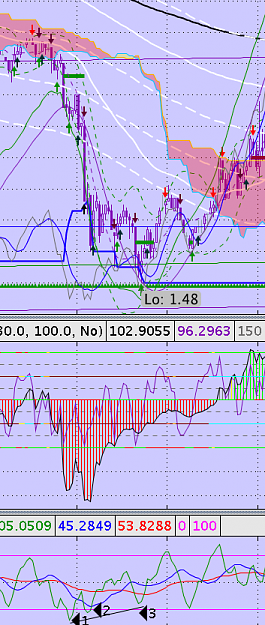
- Fx93 replied Mar 9, 2012
Weekly Linear Regression Channel Study — Here's a weekly linear regression channel study of the Euro, it is pretty interesting how some lows and highs are predicted.
EURUSD
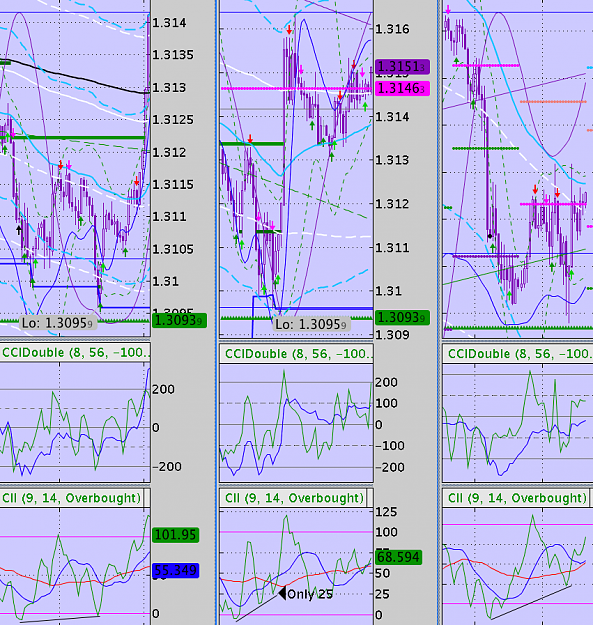
- Fx93 replied Mar 7, 2012
Here's the divergence on the CII at the the time of the reversal on the 2M, 10M, 1H charts. I do trade a setup similar to that on the 10M chart in the middle where it goes below 0 first then divergence occurs while the blue line is above the red ...
EURUSD
- Fx93 replied Feb 29, 2012
Yes, a strategy to buy as soon as the RSI goes OS at 30 will lose, the key is throwing divergence in there.
EURUSD
- Fx93 replied Feb 26, 2012
I like to trade this setup: It's basically where two divergent peaks or troughs occur on the CII above 100 / below 0, but the third does not go above 100 / below 0.
EURUSD
- Fx93 replied Feb 23, 2012
It makes sense to short that down channel, I am. We may get one more push higher, but then I think there will be a correction. However, with things perceived to me improving there may indeed be a channel break. It may also be that the S&P will ...
EURUSD
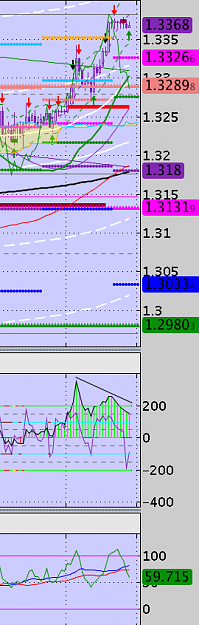
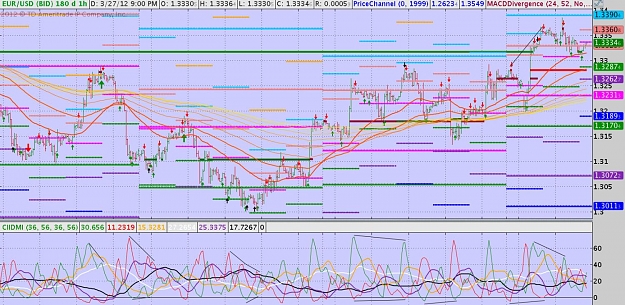
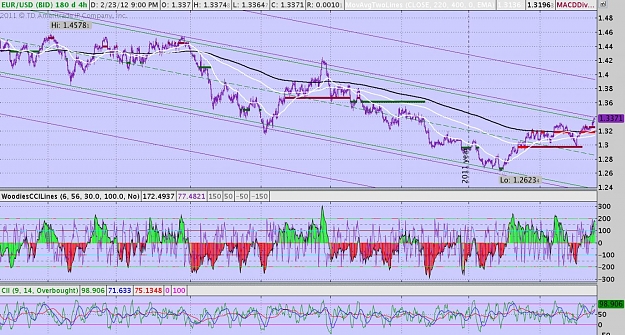
- Fx93 replied Feb 23, 2012
Here's a 180 day 4H chart showing the standard deviation and error bands. We're right at the top of that long down channel.
EURUSD
- Fx93 replied Feb 21, 2012
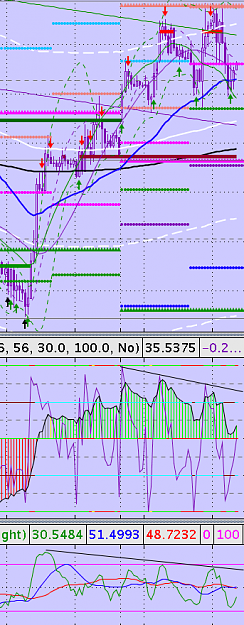
It's getting divergent on the hourly, but the CCI hasn't gone above 200 yet. There could either be a great short opportunity ahead or a really big push.
EURUSD
- Fx93 replied Feb 20, 2012
Wow, what a surprise, up 66 pips all of a sudden. I took that trade just screwing around based on divergence, playing the CCI being below -200 and consecutive divergence on the CII on the 2M chart. I watch the 2M, 10M, 1H for my trades.
EURUSD
- Fx93 replied Feb 16, 2012
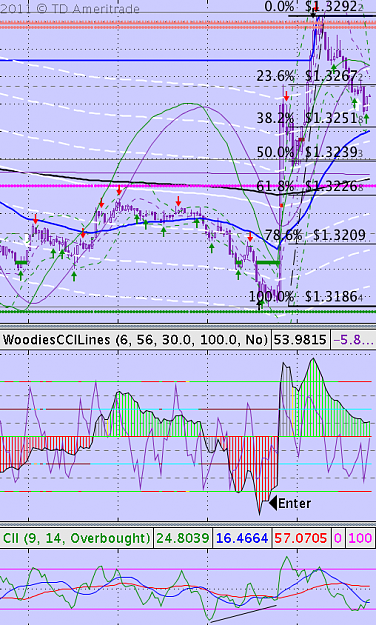
Short at 1.3138, trying this divergence on the CCI. I like this Woodies' CCI, I'm using a 56 period rather than the 14, and then the normal 6 period fast CCI. My entry is when the 6 CCI crosses below the 56 CCI and the 100 line on the 10M chart. I ...
EURUSD
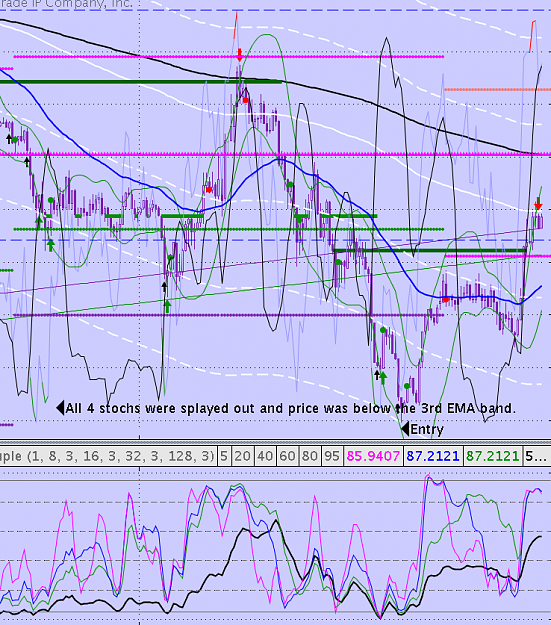
- Fx93 replied Feb 14, 2012
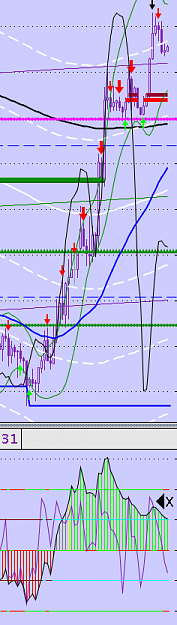
There was also nice stoch divergence on the 10M chart. I have noticed the best is when all four stochs, the 8, 16, 32, and 128 are splayed apart with divergence showing.
EURUSD
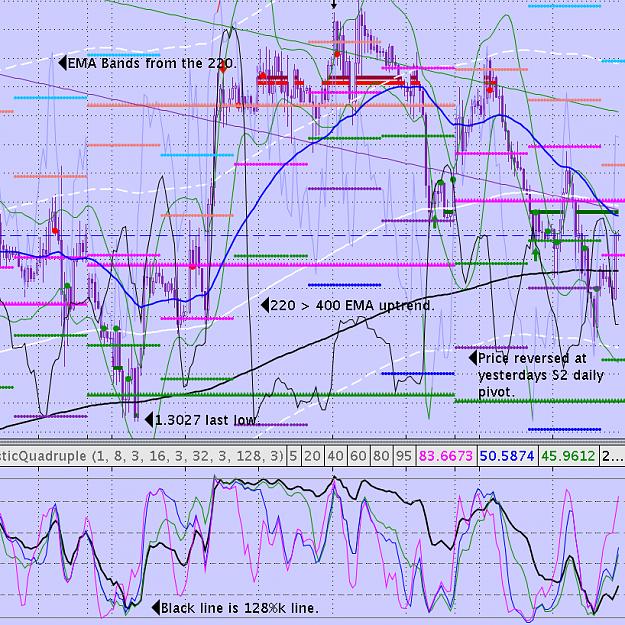
- Fx93 replied Feb 14, 2012
I entered at ~1.3080 today since it was yesterday's S2 daily pivot and there wasn't one for quite a while down with a stop at about 1.3155, since if it went much lower it would mean it would test the lows at 1.3030, due to the hourly still being up.
EURUSD
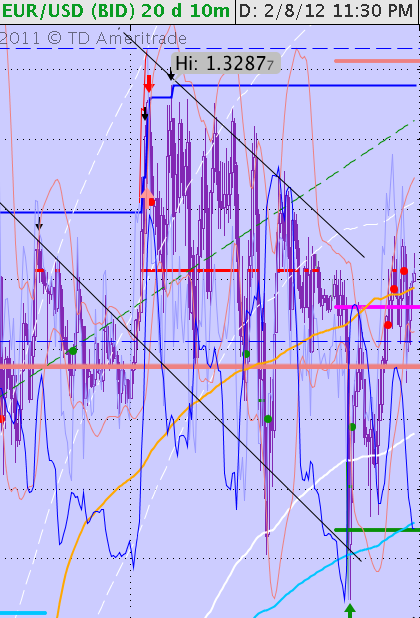
- Fx93 replied Feb 8, 2012
It's trying to break out of this downward channel, it seems like it will.
EURUSD
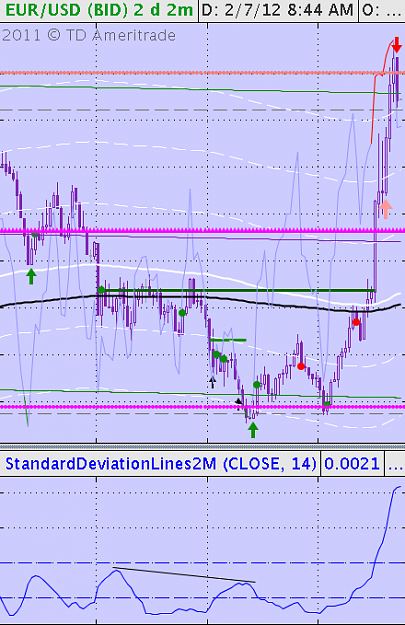
- Fx93 replied Feb 7, 2012
I entered based on divergence in standard deviation and a bounce on the daily pivot. Yesterday we saw a bounce off the weekly S1 pivot and I expected a retrace to the daily pivot. I sold at the R1 daily just to bank +60 quick pips. It seems likely ...
EURUSD
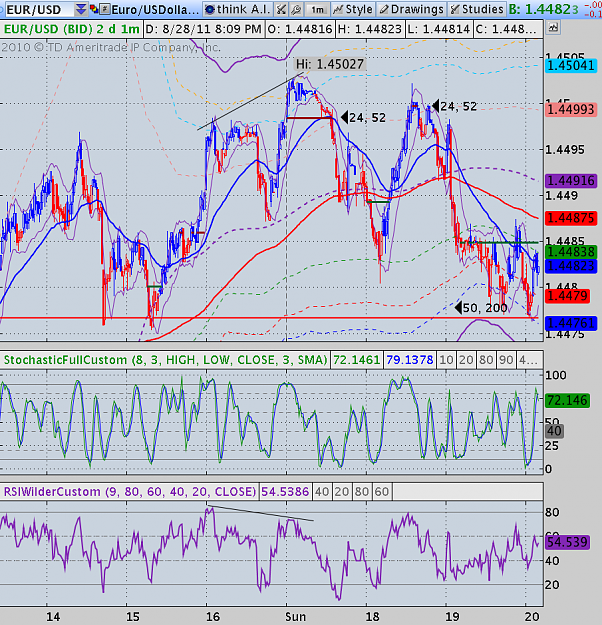
- Fx93 replied Aug 28, 2011
Here is a recent chart of the EUR/USD showing a perfect entry on the 1m good for 20 pips: there is divergence between two peaks above two MACD signal lines. My MACD signal lines are labelled: dark red is 24, 52 and light red is 50, 200.
Fx93’s Multi-Timeframe Swing Trading Based Upon Divergence