- Search Forex Factory
- 29 Results
-
 Firstboss replied Oct 27, 2023
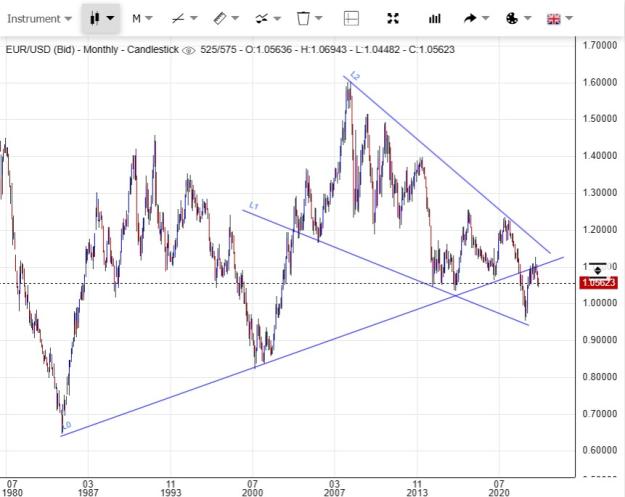
You shouldn't apply biased political ideology to analyzing markets and especially to trading. Political emotions cloud the judgement and prevent you from seeing trends, levels, and targets. If you look at the monthly candles and multi-year trends, ...
EURUSD
- Firstboss replied Aug 5, 2015
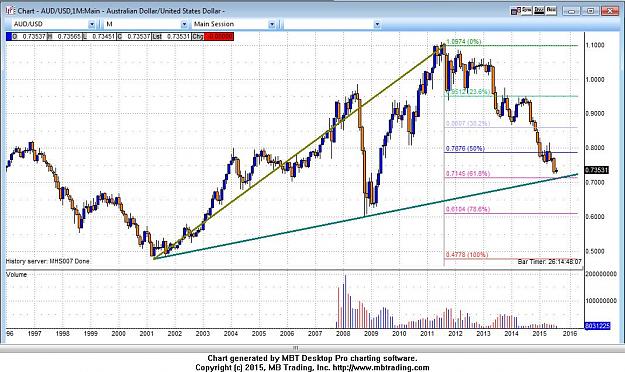
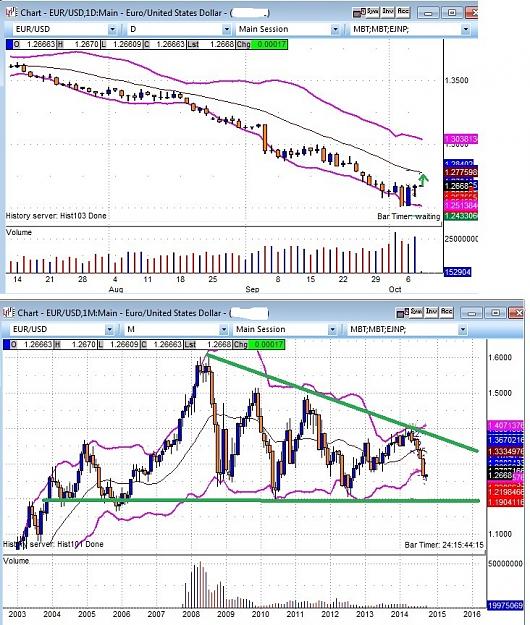
A look at the big picture is better than a thousand words. Within a few months we should have a sweet ride north.
AUD/USD
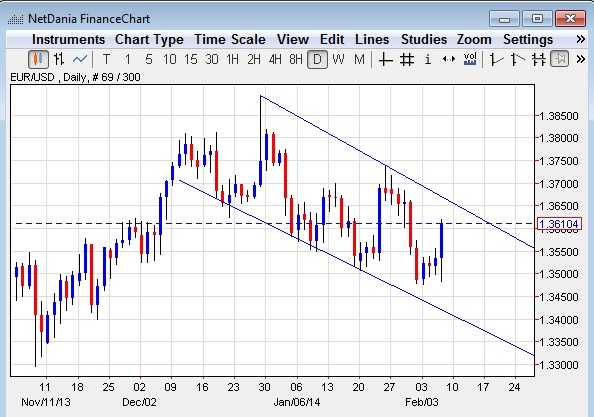
- Firstboss replied May 3, 2015
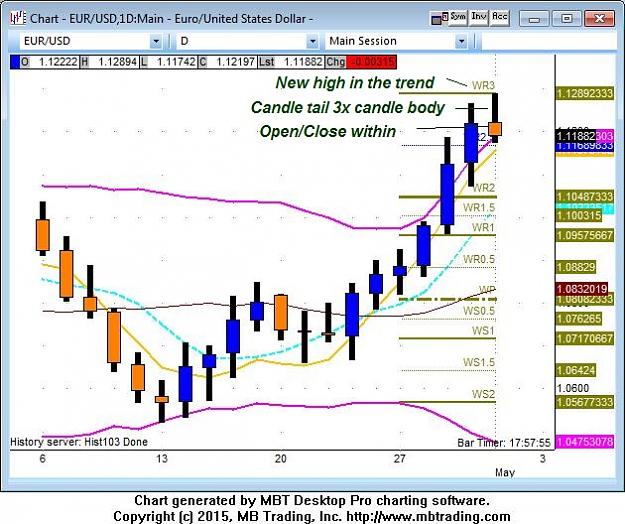
The sharp bullish correction in EUR/USD might have come to an end - the daily chart shows a bearish pin bar (a.k.a. rejection candle). Not the strongest or the most beautiful pin bar - candle body isn't too small, but the minimum conditions are met. ...
EURUSD
- Firstboss replied Nov 13, 2014
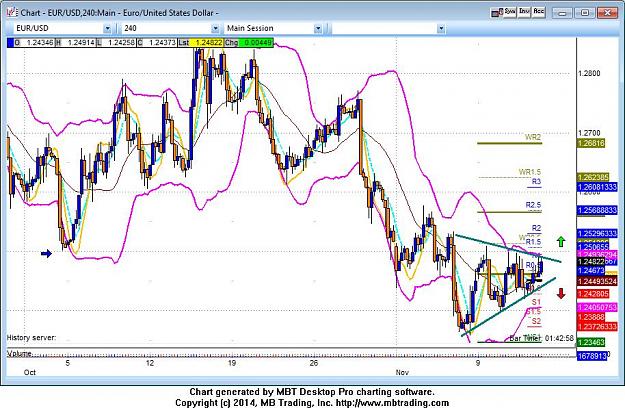
EUR-USD, 4-hr chart: I see formation of a flag since November 6. It may be bearish continuation pennant or a turnaround for a correction within the daily bearish trend. On the EU GDP numbers I expect the flag to be broken decisively. If GDP results ...
EURUSD
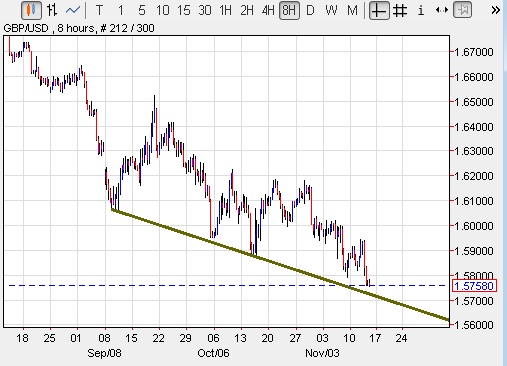
- Firstboss replied Nov 13, 2014
I wouldn't say it is oversold at all - it falls nicely in a long-term trend (8-hr chart scale). The bottom trend line should provide support. We had been held at the weekly S1 pivot (1.5759) - that's why the temporary delay. I call for the daily S1 ...
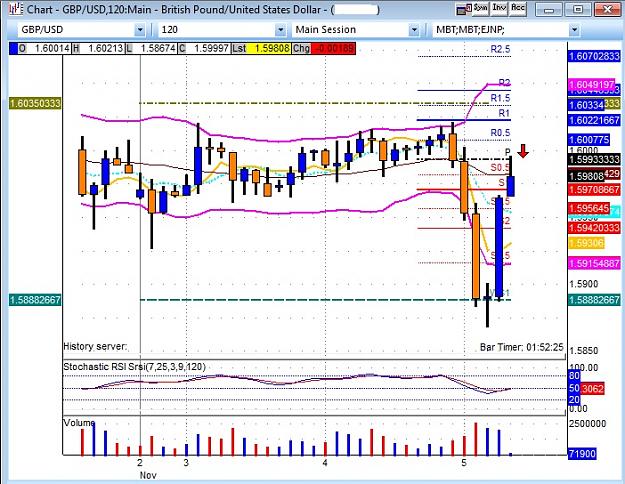
Cable Update (GBPUSD)
- Firstboss replied Nov 5, 2014
Earlier GBP/USD broke through the side channel, 1.5950 support and plunged all the way to the weekly S1, made a beautiful turnaround and retested the daily central pivot. That was a great shorting opportunity. My stop loss is at 1.6042, take-profit ...
Cable Update (GBPUSD)
- Firstboss replied Oct 15, 2014
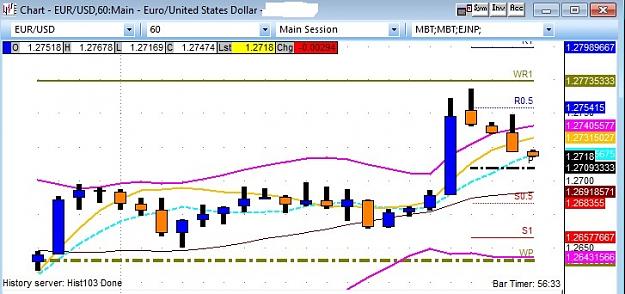
Here is what happened today - technically: Previously, PA was stuck between the two weekly levels - 1.2640 and 1.2774 During the hysterical rush to 1.2880 earlier today that whole candle found itself outside of the Bollinger Band on the 1-hr chart - ...
EURUSD

- Firstboss replied Oct 15, 2014
Weekly R1 (1.2775) must be cleared decisively for the bullish trend to materialize. Otherwise, EUR/USD will be stuck between the two weekly's (1.2640 at the bottom)
EURUSD
- Firstboss replied Oct 14, 2014
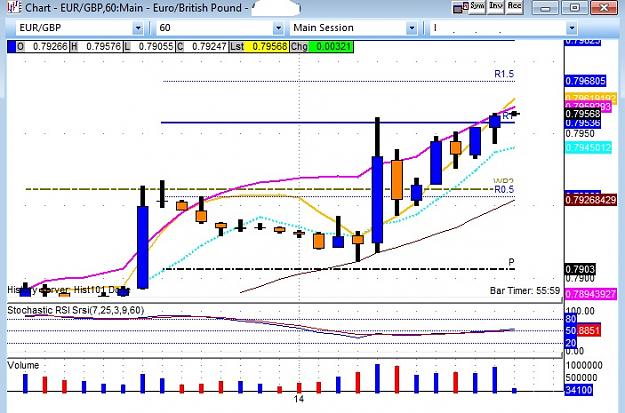
Nice break of daily R1 on EUR/GBP (see chart), I went long 2 pips above it. Running a fresh long on EUR/USD from 1.2668
EURUSD
- Firstboss replied Oct 14, 2014
@Miguel.N, interesting triangle observation
EURUSD Right now price action is tightly squeezed between the weekly pivot (1.2646) and the daily S1 (1.2657) It needs to break upwards to target 1.269x (middle of Bollinger Band) I have a long ...
- Firstboss replied Oct 14, 2014
The scenario worked out, yesterday euro weakness seems to be connected to USD/JPY (it was testing the trendline @106.80 at the time). There is a story on Blooberg about Japanese investors massively moving euro bond holdings into dollars. Someone ...
EURUSD
- Firstboss replied Oct 13, 2014
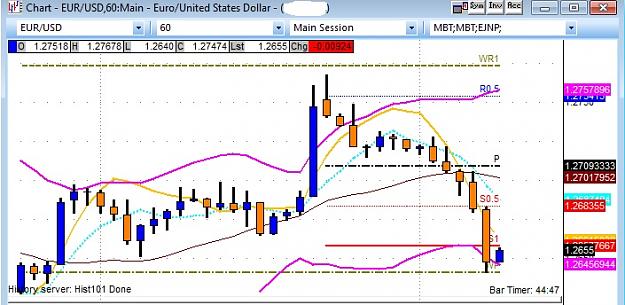
Levels to watch: Weekly R1 (WR1 on chart) @1.2773 - needs to be broken to consider a sustained northern correction. Daily pivot (now being tested) @1.2709. If holds, it's a positive sign for the bulls If broken, at least expect a consolidation ...
EURUSD
- Firstboss replied Oct 10, 2014
Of course not today. 1.2638 is the daily S1, and 1.2646 is the weekly R1 - together they form a wall for the low-liquidity final hours of the week. Perfect for scalping shorts. By the same token, I shorted GBP/USD @1.6064 for guaranteed and free 12 ...
EURUSD
- Firstboss replied Oct 10, 2014
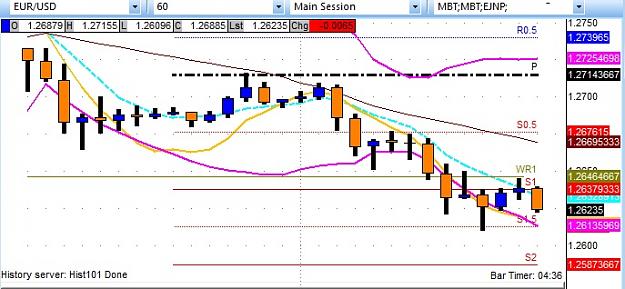
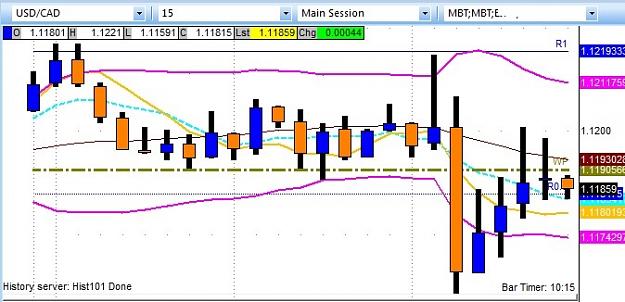
@Chazzle, on USD/CAD the weekly R1 (greenish line, 1.1190) must be decisively broken in order to justify longs. It was positioned to go up before the news release (note how weekly R1 was respected from the top side, not it serves as a ceiling) I am ...
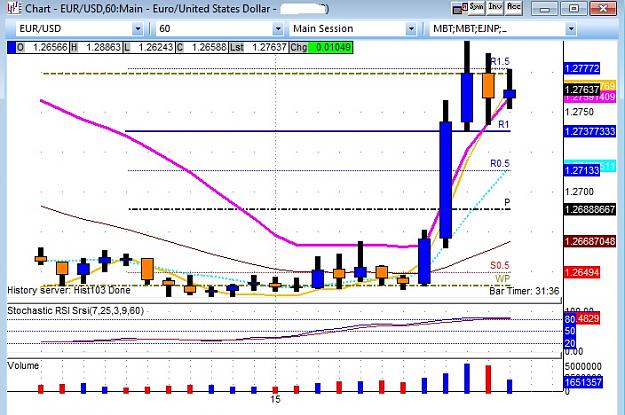
EURUSD
- Firstboss replied Oct 10, 2014
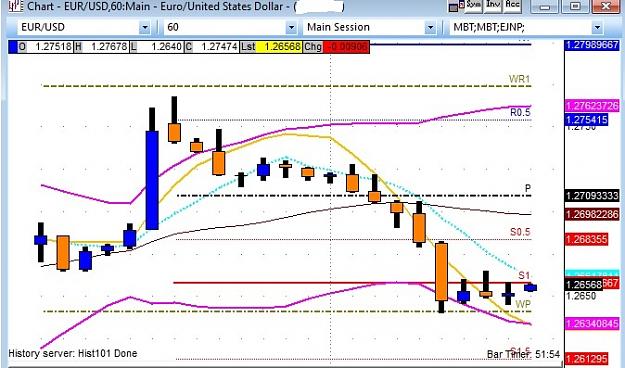
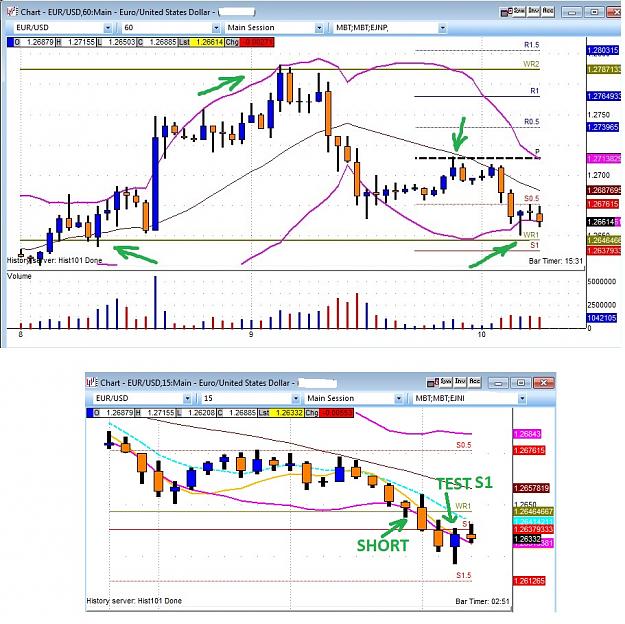
I am short EUR/USD since the decisive breach of the Weekly R1 level (second chart) Right now it's testing the daily S1, from below. My stop-loss - few pips above Weekly R1. Notice on the first graph how the weekly levels were respected to the pip ...
EURUSD
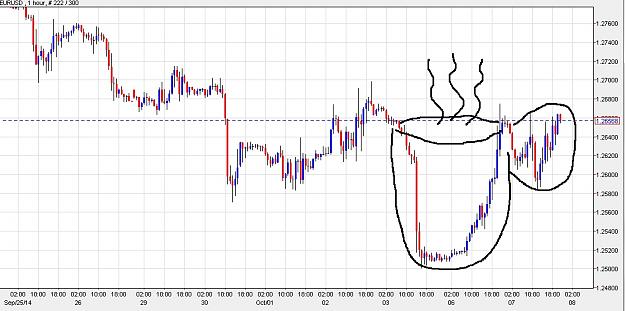
- Firstboss replied Oct 7, 2014
Day closed and opened above the strong level of 1.2660 (Nov 2012 low) that was breached after NFP last Friday. Plus, the cup and handle figure formed with its top at this level. I expect a correction to mid-1.27's before FOMC minutes are released ...
EURUSD
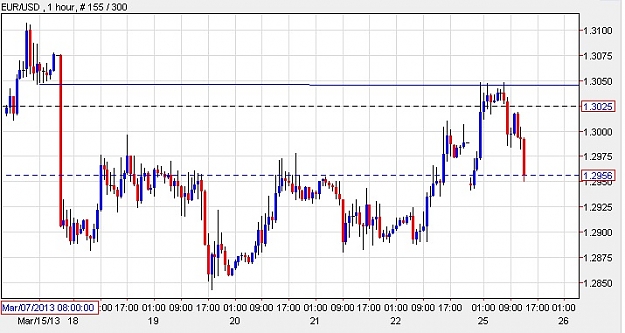
- Firstboss replied Mar 25, 2013
Not at all - I am saying the gap has been closed last night @1.3046 (on 1-hr candles) Rather sloppy speculative close showing it is not ready to go any higher image
EURUSD
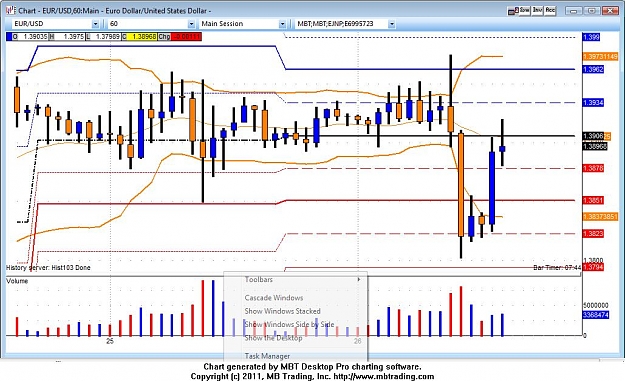
- Firstboss replied Oct 26, 2011
The Bollinger Band on 1 hour chart has opened up on last spike down. Next time the price action reaches either side of the range we are likely to see the breakout and end of the range trading opportunities that we've enjoyed for the last 4 days. It ...
EURUSD