- Search Forex Factory
- 16 Results (2 Threads , 14 Replies )
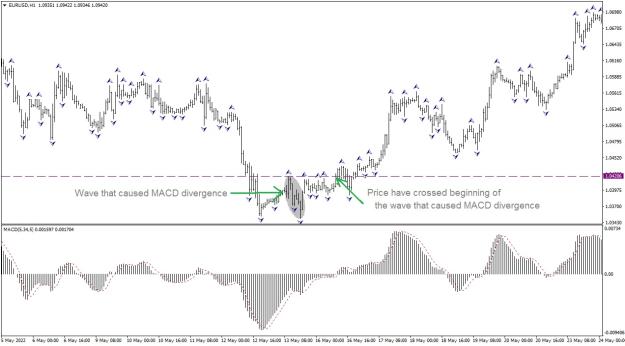
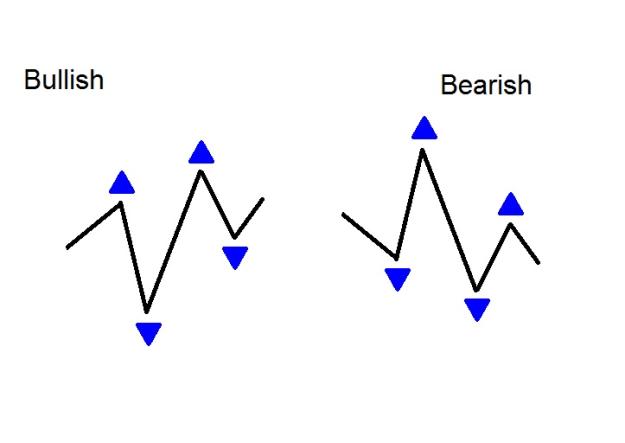
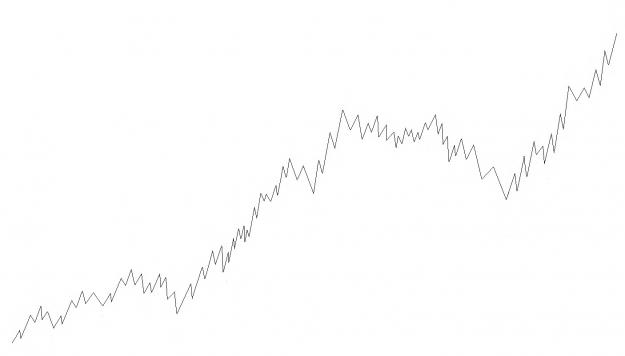
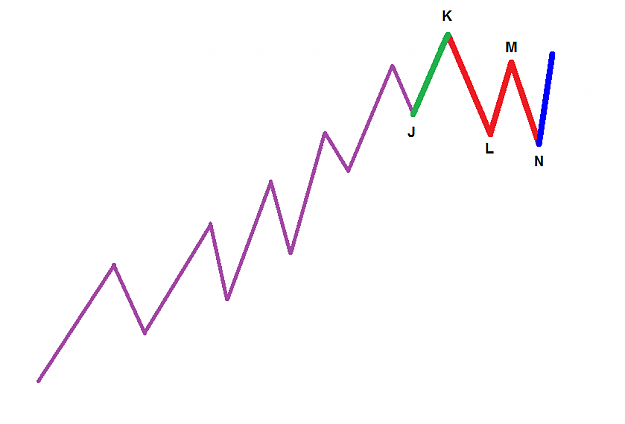
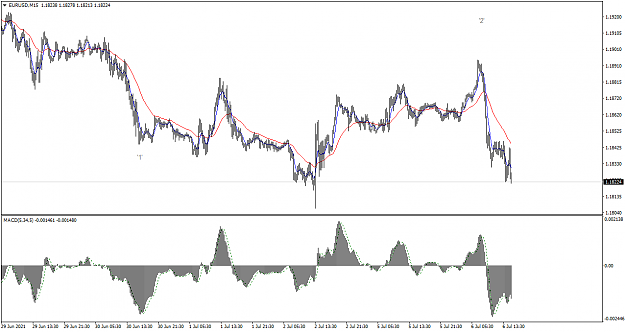
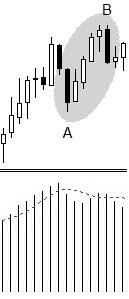
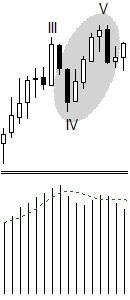
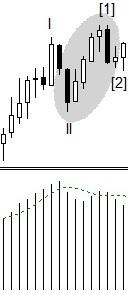
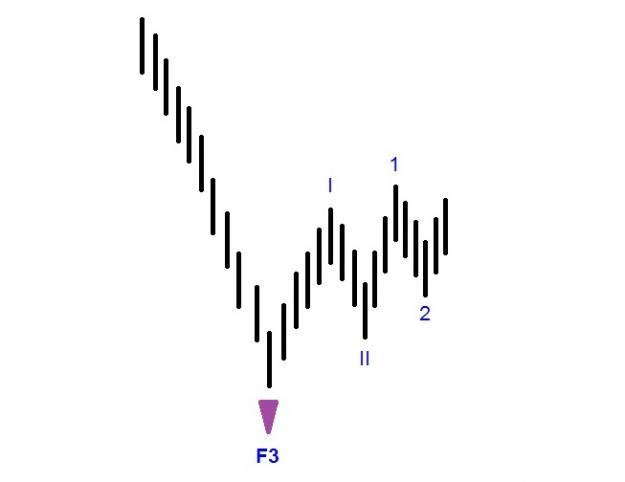
- ByeMyDeposit replied Aug 22, 2023
In this type of Fractal Formation, after fractal F4 was fully formed, price will often cross fractal F4 before crossing fractal F3. image If price crossed fractal F3 before crossing fractal F4, it may still cross fractal F4 before going further in ...
- ByeMyDeposit replied Jun 17, 2023
Another example of a sign of possible ending of some larger degree wave - price have crossed beginning of the wave that caused MACD divergence. image
- ByeMyDeposit replied Jun 10, 2022
In this archive 50 screenshots of 25 Conditions on EURUSD H1 and M5 (12 times smaller) timeframes from 02.03.2022 to 10.06.2022 (demo account). By Condition I mean a situation when on H1 chart the price crosses the first Fractal to the left from ...
- ByeMyDeposit replied Apr 7, 2022
This seven fractals structure on EURUSD 15 minutes timeframe looks like an impulse wave. Fibo relation between waves 1 and 5 is 0.618. image
- ByeMyDeposit replied Apr 2, 2022
Interesting fractal structure on 28 minutes timeframe, EURUSD. Five consecutive fractals look like an impulse wave. Fibo relations between waves 1 and 3 is 261.8, between waves 1? and 5 161.8. Ending of the first wave may be 1? instead of 1 if wave ...
- ByeMyDeposit replied Mar 14, 2022
Here are drawings of impulse wave with three (some with four) degrees deep subwaves, with and without wave markings. These pictures may help with studying EWA and creation of trading plans. image image
- ByeMyDeposit replied Dec 22, 2021
Fractals may help with finding timeframe on which sub-waves of the wave of higher degree are seen most explicitly. image For example, on a timeframe six times smaller than the timeframe of the picture above, something like this may be seen: image
- Fractals and EWA
In this thread I want to share some of my observations of fractals of Bill Williams combined with ...
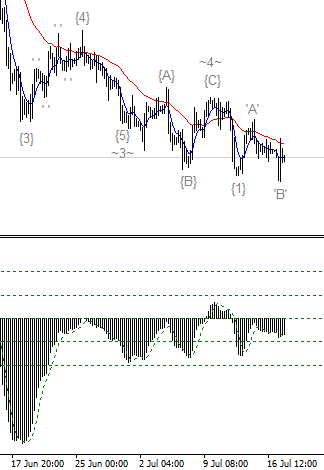
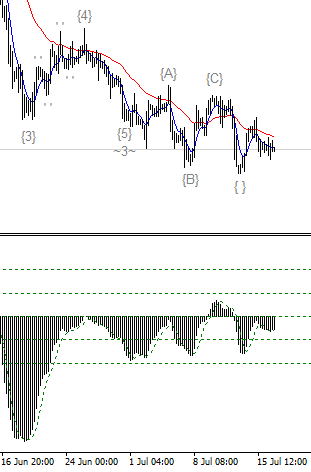
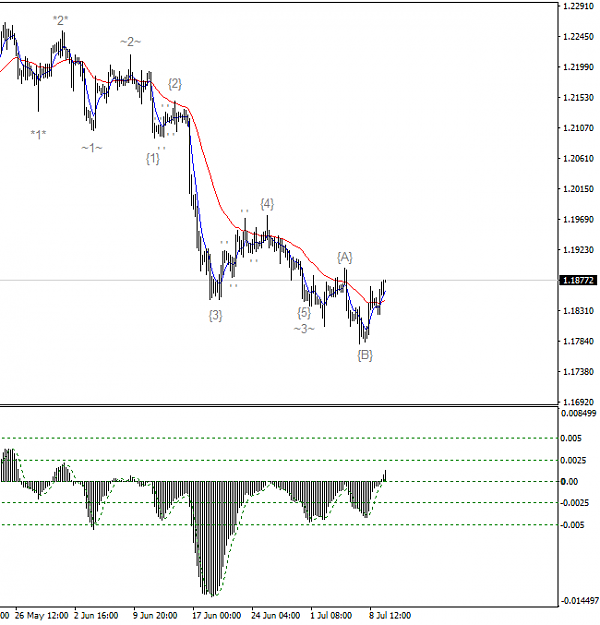
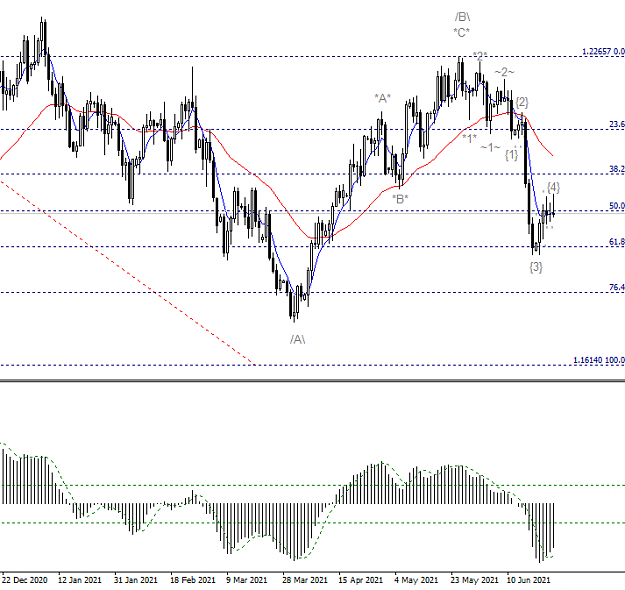
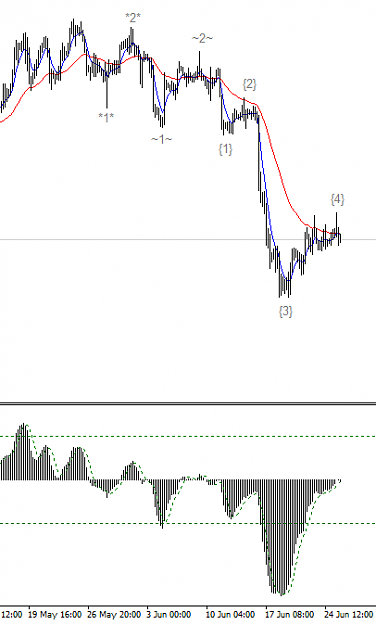
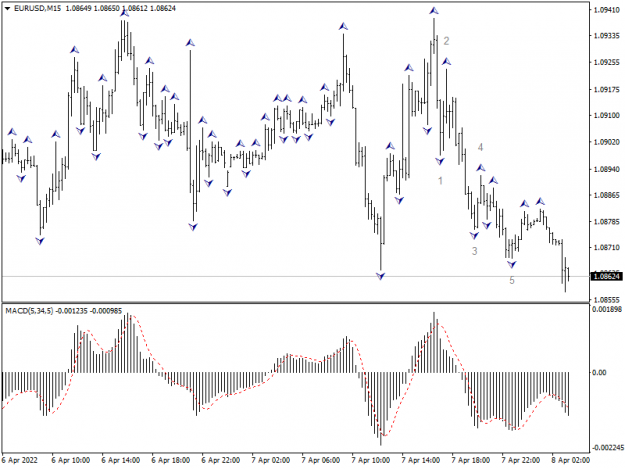
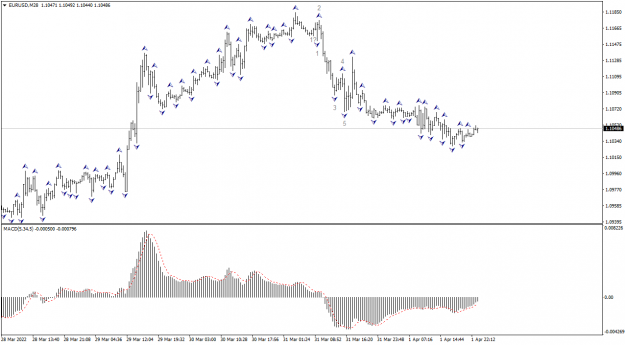
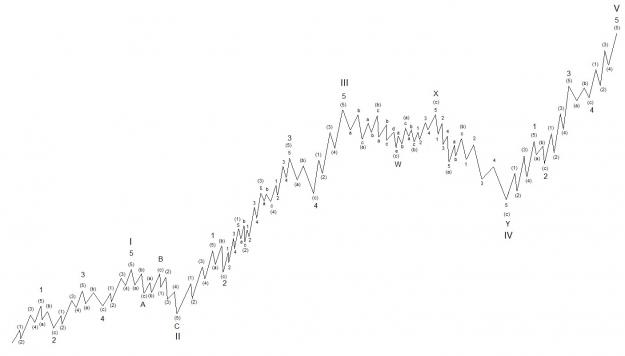
- EWA Wave End
In this thread I want to share some of my observations of Elliott Wave Analysis (EWA), in ...
- ByeMyDeposit replied Jul 19, 2021
My current view of EURUSD H4. I agree that significant bearish movement is most probable, though I expect wave 'C' to be somewhere around 1.18505 before that.
- ByeMyDeposit replied Jul 17, 2021
My current view of EURUSD H4. That { } wave seems to be of the same degree as A B C though I'm not sure how to label it.
- ByeMyDeposit replied Jul 9, 2021
It seems to be that "less possible option". My current view of EURUSD H4
- ByeMyDeposit replied Jul 6, 2021
Isn't it irregular second wave? EURUSD, M15
- ByeMyDeposit replied Jun 27, 2021
How do you label that entire A-B-C bearish movement on EURUSD H4 ? If that A-B-C is an entire correction, how do you label the wave that I labeled as /B\ in this EURUSD Daily chart? As wave A of irregular wave B of higher degree or something else? ...
- ByeMyDeposit replied Jun 27, 2021
To me that bearish movement on EURUSD H4 looks more like an extension, most likely wave C.
- ByeMyDeposit replied Jan 6, 2021
Price movement, that makes MACD divergence (first divergence, if it's a series of divergences), seems to be one of the following: Wave B image Last wave of the same degree as the wave that has ended at previous peak image First wave of degree ...
- Posts by Member Search: 'ByeMyDeposit'