- Search Forex Factory
- 21 Results
- Alec replied Mar 4, 2012
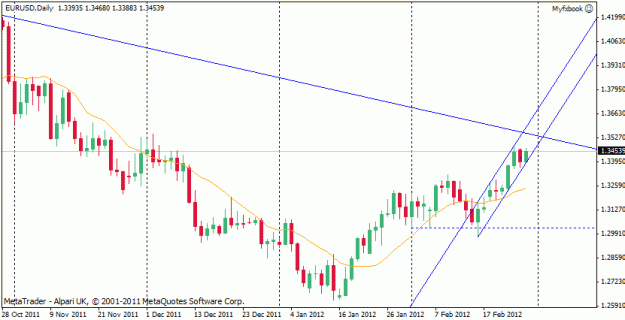
Me, I'm much longer that I'd like to be (as I said here). But now I see a bearish pennant and it broke down. Any of you cares to share your views with a chart or two?
EURUSD KW?
KW?

- Alec replied Mar 4, 2012
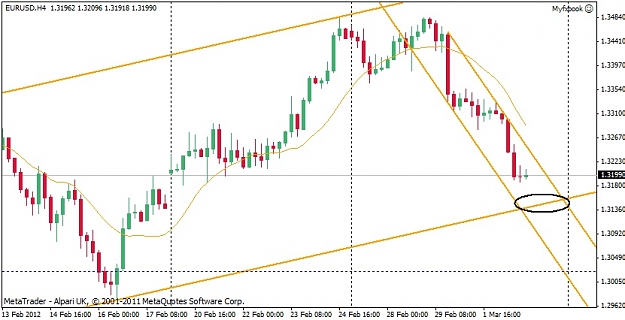
Good day
EURUSD So most of you guys think the descending channel will win here?


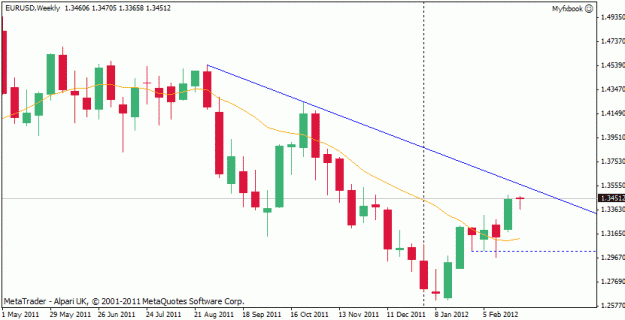
- Alec replied Feb 28, 2012
In simpleton mode, this is what I see. Of course that channel isn't made of steel..
EURUSD
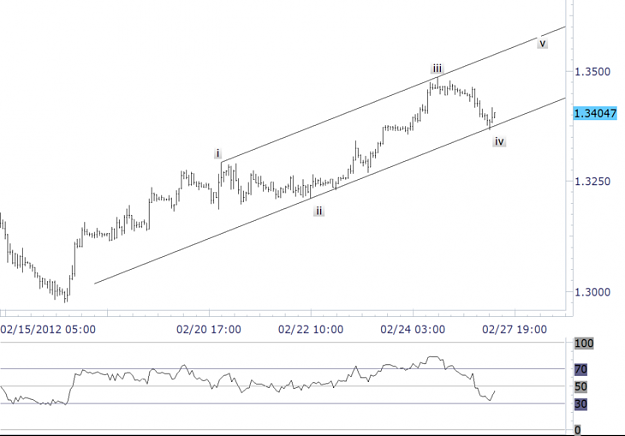
- Alec replied Feb 28, 2012
Beautiful chart I (did not) draw. "Elliott channel (1 hour) suggesting a low is in place in wave 4. look higher" Jamie Saettele, yesterday
EURUSD
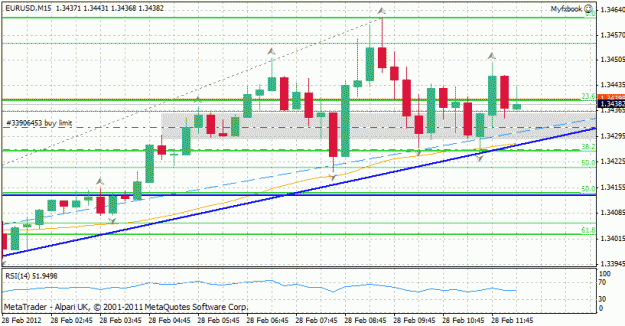
- Alec replied Feb 27, 2012
Breaking down now or what? I've seen 2 episodes of Dexter already! Not yet, apparently. Going to sleep. It's 5:45 am.
EURUSD
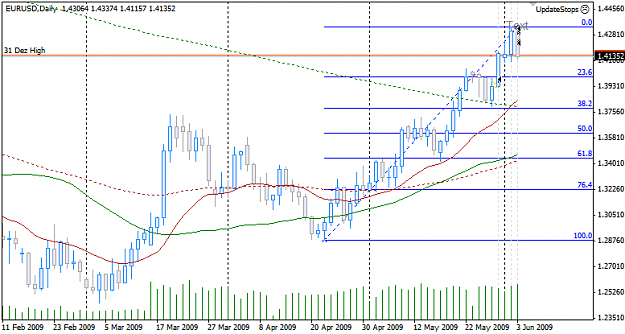
- Alec replied Jun 4, 2009
Your Dr. Joe story was very inspiring. As for the fibs, would this be more accurate? image
Strat's Long Term Stress Free Trading

- Alec replied Jun 3, 2009
Don't get me wrong - I like to look at the bigger picture, get some perspective. In fact, I used to do that a long time ago, when I started - about 3 months ago :| To know which SR lines were important was sometimes very puzzling. Now an example ...
Strat's Long Term Stress Free Trading
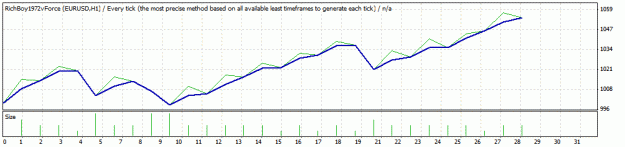
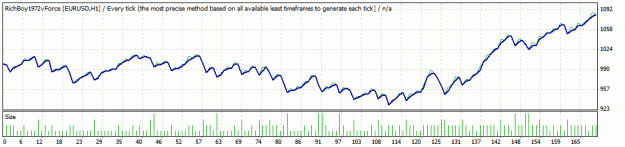
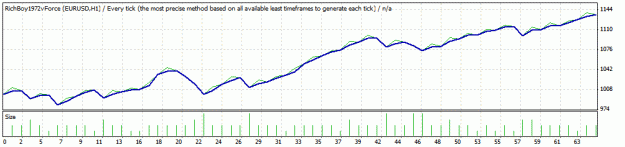
- Alec replied May 24, 2009
Funny, the same happened to me today (almost). I'm not very versed on the backtesting inner workings, but I tested the EA with the M15 time frame and the results were... not good. Then, and since I'm now forward testing on demo in H1 (I read Richboy ...
"vForce" the revolution
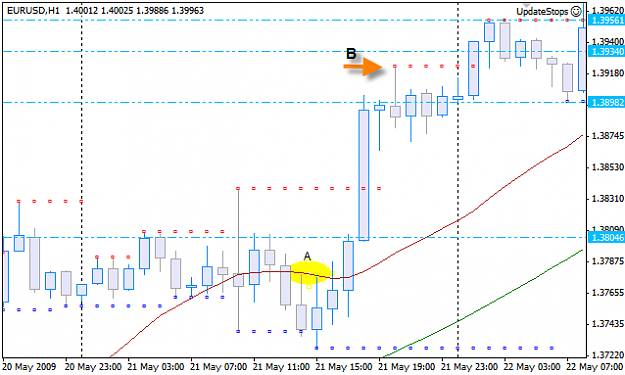
- Alec replied May 23, 2009
Yes, I get what you say. What happened was that the price went below the curve. There are two candles (barely, but they are) below the SMA (area 'A' in the chart). Then the price crossed back up and the first fractal after that ('B' in the chart) ...
Yet another 50 SMA trading strategy
- Alec replied May 21, 2009
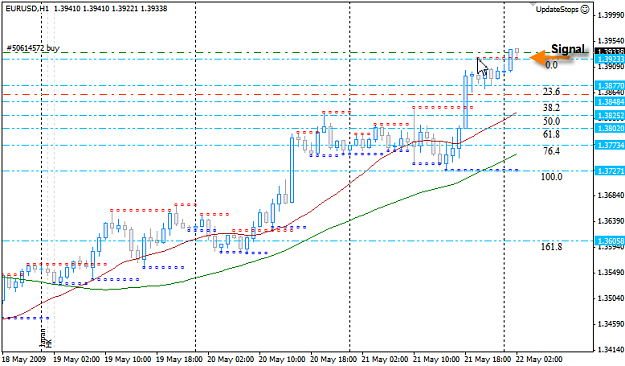
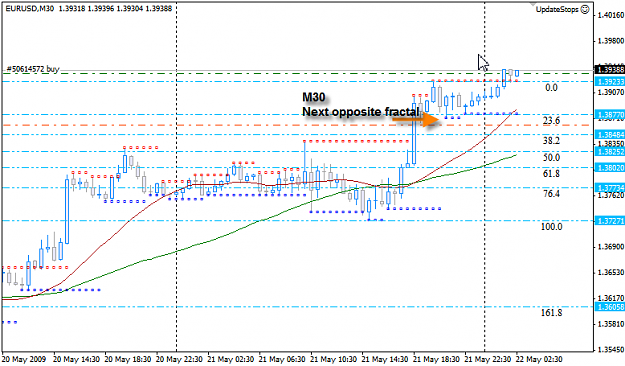
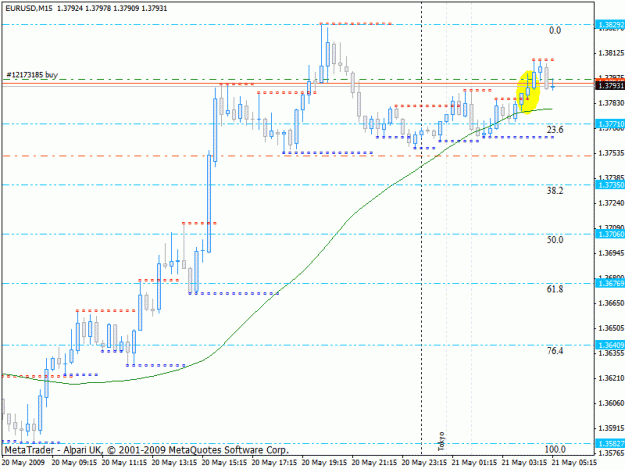
Longer TF — Regarding that, this is what I did: On the H1 chart, I found a break of the SMA(20) (the redish one) and the corresponding long signal fractal. image I found the previous opposite fractal too far so, trying to find an ...
Yet another 50 SMA trading strategy
- Alec replied May 20, 2009
Thank you, yes it was. The price just happened to reverse direction and (if I understand correctly how to express P/L in percentages) I lost 1%. Now I'm hoping I can recover with this long on EUR/USD. image Which... Don't look so good right now. ...
Yet another 50 SMA trading strategy
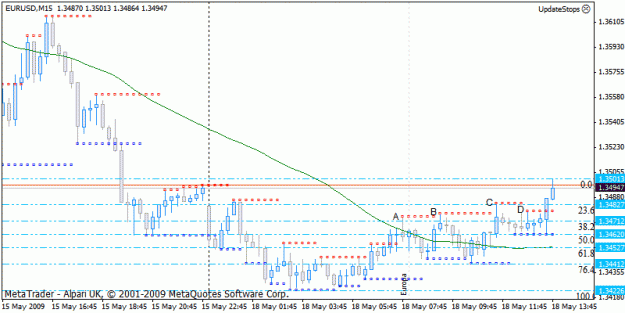
- Alec replied May 18, 2009
Melpheos, in this situation, which of the fractals would have been the signal - A, B, C or D? And why? Is it the first, the last, the highest, the lowest...? Thank you for your help. image
Yet another 50 SMA trading strategy
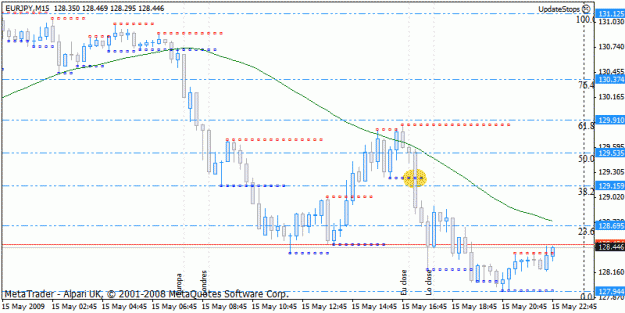
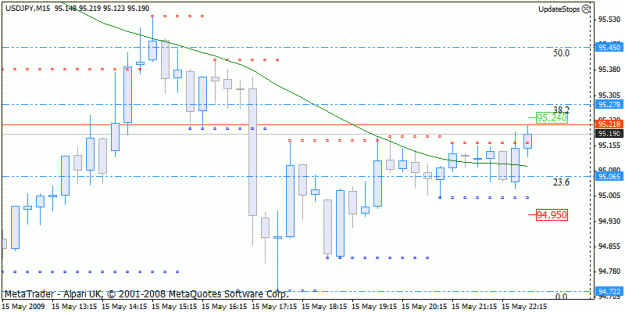
- Alec replied May 17, 2009
You mean that one? image I took it here and on $Yen, my happy first trades with this system
Yet another 50 SMA trading strategy Just my exits... Not so good. The first one, invalid, was good on €$.
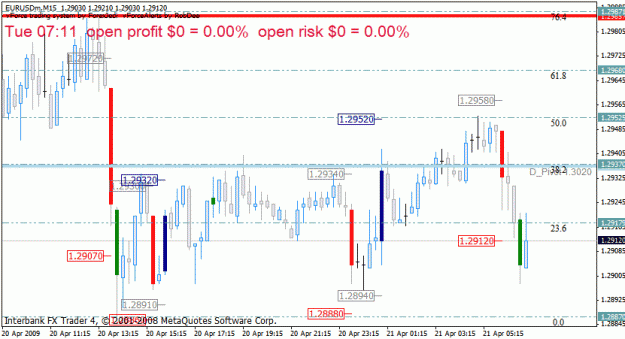
- Alec replied May 17, 2009
If this wasn't the weekend gap, this would be the right setup now, would it? -- Entry and SL, with 5 pip distance for signal confirmation, plus 2.8 on the upside for spread -- image Sorry for the fibs, guys.
Yet another 50 SMA trading strategy
- Alec replied Apr 21, 2009
What? — Any comments on the market's weird behavior since yesterday afternoon? And how do deal with it. vForce signals have been virtually useless. To me anyway. Thanks. Have a good day.
vFORCE EU Only
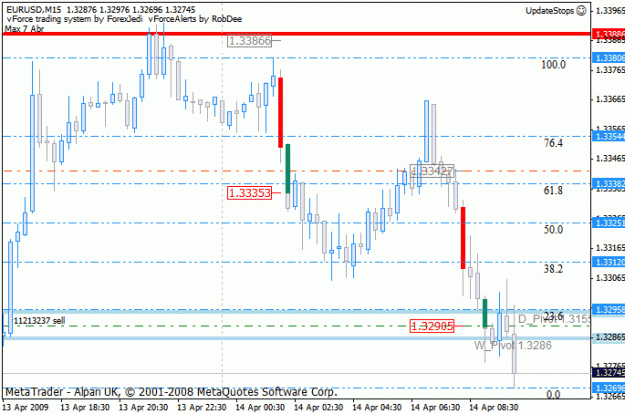
- Alec replied Apr 14, 2009
Got that one too, nice one. Now, I was unsure to take this last short signal (1.32905, Alpari UK), with the daily and weekly pivots there, but it went well (chart attached). I must review the fib 'lessons' I had last weekend because, after I saw the ...
vFORCE EU Only