-
USD: ‘Watchout Chart’ Now Becoming A ‘Lame Duck Chart’
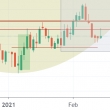
The bullish power that we observe in this market is really strong. The two crash indicators that we closely track are in the process of giving up. In this article we look at one of those two indicators: the USD. The other crash indicator is analyzed in Breaking News: Crash Indicator VIX Started An Epic Breakdown. We flagged the USD as the ‘watchout chart’ for February. Although it still needs to be watched closely, it is clear that the USD was not able to create any harm whatsoever. From ‘watchout chart’ to ‘lame duck chart’ in two weeks, pretty impressive, the bulls are really doing a good job pushing ... (full story)
- Comments
- Subscribe
- Comment #1
- Quote
- Feb 15, 2021 12:34am Feb 15, 2021 12:34am
-
 kingleeny
 - Joined Jul 2014 | Status: Member | 1479 Comments
- Comment #2
- Quote
- Feb 15, 2021 4:13am Feb 15, 2021 4:13am
-
 YoungKing
 - | Commercial Member | Joined Mar 2019 | 148 Comments
Hard Work, Never Loss
- Comment #3
- Quote
- Feb 15, 2021 8:38am Feb 15, 2021 8:38am
- Yawgmouth
- | Joined Feb 2020 | Status: Member | 116 Comments
- Comment #4
- Quote
- Feb 15, 2021 11:09am Feb 15, 2021 11:09am
- ericyerome
- | Joined Aug 2020 | Status: Member | 48 Comments
- Story Stats
- Posted: Feb 14, 2021 11:43pm
- Submitted by:Category: Technical AnalysisComments: 4 / Views: 2,009