-
About Forex Factory / Blog / Page 5
A fresh face for the new year
December 31, 2012
We've completed the rollout of Forex Factory's new front-end. 
It's a lot more than a facelift! The new front-end utilizes the latest web technologies to load the site faster and make it more consistent across browsers and devices.
While the functionality of the site remains mostly unchanged, the design introduces a new "sticky" navigation that consistently keeps all FF products just one click away. The navigation also employs a wider layout to tap into muscle-memory, thereby reducing the amount of effort needed to get around the site.
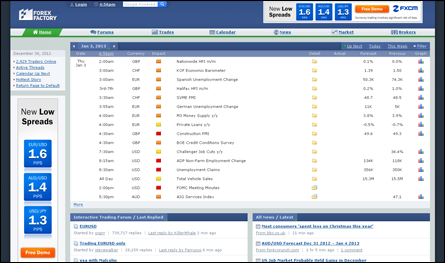
Forget how the site used to look? Here's a screen capture right before the new front-end launched:
We've already received some great feedback – thank you very much! We're working hard to improve on issues that have been brought to our attention, and you can expect to see constant improvements in the coming weeks.
Thanks for helping to make 2012 another great year for Forex Factory! Best of luck in the new year!
It's a lot more than a facelift! The new front-end utilizes the latest web technologies to load the site faster and make it more consistent across browsers and devices.
While the functionality of the site remains mostly unchanged, the design introduces a new "sticky" navigation that consistently keeps all FF products just one click away. The navigation also employs a wider layout to tap into muscle-memory, thereby reducing the amount of effort needed to get around the site.
Forget how the site used to look? Here's a screen capture right before the new front-end launched:
We've already received some great feedback – thank you very much! We're working hard to improve on issues that have been brought to our attention, and you can expect to see constant improvements in the coming weeks.
Thanks for helping to make 2012 another great year for Forex Factory! Best of luck in the new year!

Comment
14
comments
New FF logo
November 28, 2012
Behold! Forex Factory has a new logo!

We stuck to our roots with a factory shape, but the new logo bears precision and meaningfulness that better represent Forex Factory's ideals and design approach.
The old logo served us well. It was a simple logo, proudly guarding over the site for almost nine years. In 2005, its shape was used as an icon to convey the expected market impact of calendar events
( ) – a pioneering feature that would later become ubiquitous in the financial world.
In 2011, the logo mark was again used to communicate market impact in an innovative way – this time signifying the actual impact of breaking news stories. Through the years, after serving millions upon millions of traders, our old logo became one of the most recognizable forex-related shapes in the world.

Goodbye ole' buddy!

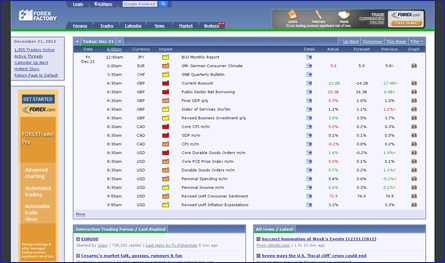
The new logo is the first step in a larger design initiative. We're currently working on a new front-end for the site that will change the way you see FF. Here's a preview:
You won't have to worry about re-learning Forex Factory, as the new design will leave the site's functionality and layout virtually unchanged. The only difference will be that the site looks better, loads faster, and will be more compatible across devices.
And thus begins a new chapter in Forex Factory's evolution.
We stuck to our roots with a factory shape, but the new logo bears precision and meaningfulness that better represent Forex Factory's ideals and design approach.
The old logo served us well. It was a simple logo, proudly guarding over the site for almost nine years. In 2005, its shape was used as an icon to convey the expected market impact of calendar events
(
) – a pioneering feature that would later become ubiquitous in the financial world.In 2011, the logo mark was again used to communicate market impact in an innovative way – this time signifying the actual impact of breaking news stories. Through the years, after serving millions upon millions of traders, our old logo became one of the most recognizable forex-related shapes in the world.
Goodbye ole' buddy!
The new logo is the first step in a larger design initiative. We're currently working on a new front-end for the site that will change the way you see FF. Here's a preview:
You won't have to worry about re-learning Forex Factory, as the new design will leave the site's functionality and layout virtually unchanged. The only difference will be that the site looks better, loads faster, and will be more compatible across devices.
And thus begins a new chapter in Forex Factory's evolution.
Aggregate positions added to Trades
June 20, 2012
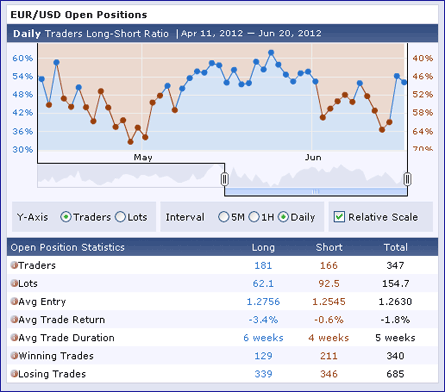
With over 3,000 Trade Explorers actively synchronizing with brokerage accounts, we can now develop some very insightful applications using the aggregate data. Our first such creation is an application called Positions. Located on the Trades page, under the Leaderboard, Positions gives unprecedented insight into how forex traders are currently positioned in the market.

Positions only includes live accounts (no demos), and goes far beyond the traditional long-short ratio. For example, it displays ratios in terms of both traders and lots, tells you which traders are long and how many lots they're carrying, shows you the lot-weighted average entry for all trades, and it displays historical ratios via interactive graph!
The aggregate numbers are made fully transparent by listing every trader that makes up the aggregate. For traders who have their Trade Explorers set to 'Public,' you can click through to their Explorer to see details about their position, and for those set to 'Private' or 'Buddies,' their positions are included in an anonymous format. Please note that traders who opt out of data aggregation (via Trade Explorer permissions) are not included in aggregate metrics or lists.

While there's a bit of a learning curve, once you master Positions it can be a powerful tool that improves your edge in the market. If you have an idea for making it more useful, or if you run into any bugs, please let us know!
Positions only includes live accounts (no demos), and goes far beyond the traditional long-short ratio. For example, it displays ratios in terms of both traders and lots, tells you which traders are long and how many lots they're carrying, shows you the lot-weighted average entry for all trades, and it displays historical ratios via interactive graph!
The aggregate numbers are made fully transparent by listing every trader that makes up the aggregate. For traders who have their Trade Explorers set to 'Public,' you can click through to their Explorer to see details about their position, and for those set to 'Private' or 'Buddies,' their positions are included in an anonymous format. Please note that traders who opt out of data aggregation (via Trade Explorer permissions) are not included in aggregate metrics or lists.
While there's a bit of a learning curve, once you master Positions it can be a powerful tool that improves your edge in the market. If you have an idea for making it more useful, or if you run into any bugs, please let us know!

Live spreads added to Brokers
June 4, 2012
Traffic to the brand-new Brokers product has exceeded all expectations – we're glad you guys like it!
We recently launched several new features that make the broker guide even better! Most notably, the spreads now update live! So not only are spreads real-time, but they now automatically update in sync with the brokers' platforms.
For live spreads just check the 'Live' option in the top-right of the Spreads section, or use this permalink: http://www.forexfactory.com/brokers.php#spreads
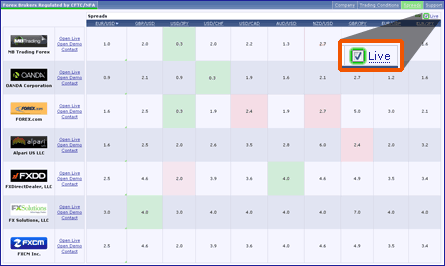
When spreads are live, a green flash signals the spread became more favorable to the trader (tighter), and a red flash signals it became less favorable (wider).
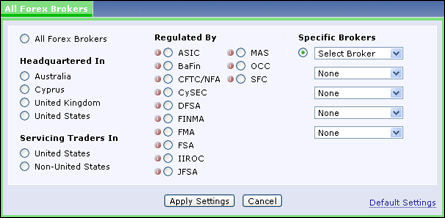
Another cool improvement is that you can now pare down the list of brokers by where they're headquartered, their regulator, or who they service. You can also select specific brokers for comparison purposes – it's all part of the Flex Box settings.
We hope you like the new features! If you have any ideas for further improvement, please contact us!
We recently launched several new features that make the broker guide even better! Most notably, the spreads now update live! So not only are spreads real-time, but they now automatically update in sync with the brokers' platforms.
For live spreads just check the 'Live' option in the top-right of the Spreads section, or use this permalink: http://www.forexfactory.com/brokers.php#spreads
When spreads are live, a green flash signals the spread became more favorable to the trader (tighter), and a red flash signals it became less favorable (wider).
Another cool improvement is that you can now pare down the list of brokers by where they're headquartered, their regulator, or who they service. You can also select specific brokers for comparison purposes – it's all part of the Flex Box settings.
We hope you like the new features! If you have any ideas for further improvement, please contact us!
New product: Brokers
May 7, 2012
We're pleased to announce the beta-release of Brokers, a highly advanced guide to regulated forex brokers. This new product is a breakthrough in the way traders research brokers, finally combining up-to-date information, extensive detail, real-time spreads, and a versatile interface that makes it easy to sort through it all!

While all information on the broker guide is kept fresh, the spreads are real-time! All spreads are pulled from each broker's standard live account (no demos) with mere millisecond of lag (click the icon to refresh). With the built-in sorting feature, you can even sort the brokers by the pair that you trade most!

You can learn more about the administration and design of Brokers in the 'About Brokers' box. We hope this new product helps you find the broker that best suits your trading!
While all information on the broker guide is kept fresh, the spreads are real-time! All spreads are pulled from each broker's standard live account (no demos) with mere millisecond of lag (click the
icon to refresh). With the built-in sorting feature, you can even sort the brokers by the pair that you trade most! You can learn more about the administration and design of Brokers in the 'About Brokers' box. We hope this new product helps you find the broker that best suits your trading!