So far, I was a learner, trying to get some geometrical ideas from this thread. Got some good ones. Thanks to those who shared them over here.
Now contributing one of mine. Honestly, I don't remember where do I get this from or is it my discovery...???
Well, that should not matter, credit will always be of the inventor...
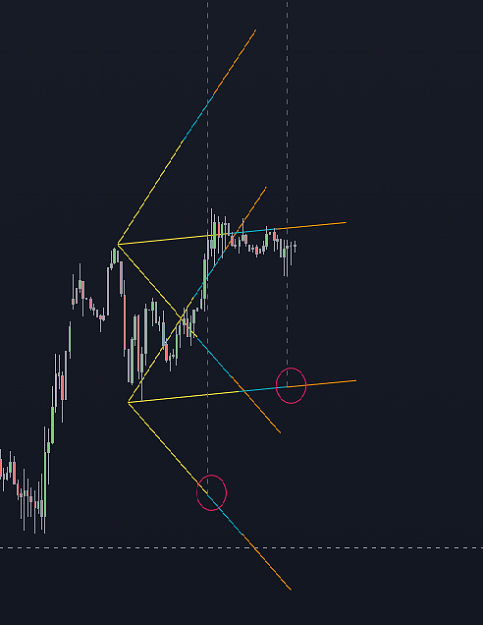
Explanation:
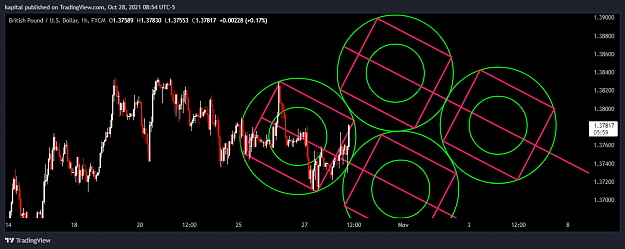
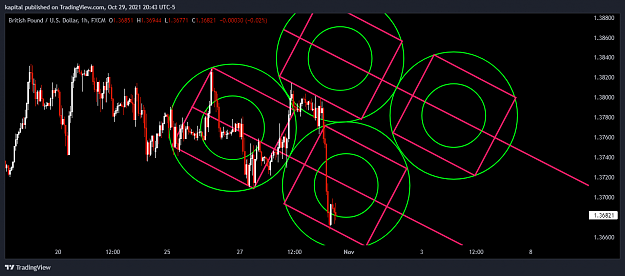
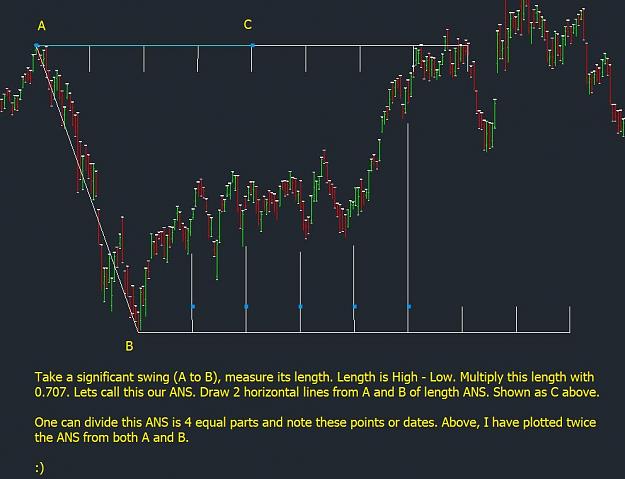
Take a significant swing. Calculate its length, from High (say Point A) to Low (say point B). Now multiply this by 0.707. Let's call this our ANS.
Now plot 2 horizontal lines from points A and B of length equal to ANS (i.e; Length of Swing * 0.707). The end of these lines gives trend reversal with +/- 1D.
It's that simple.
Here, we can take 0.618, 0.707, 1.414, and so on. Give it a try. I follow 0.707.
Some modifications:
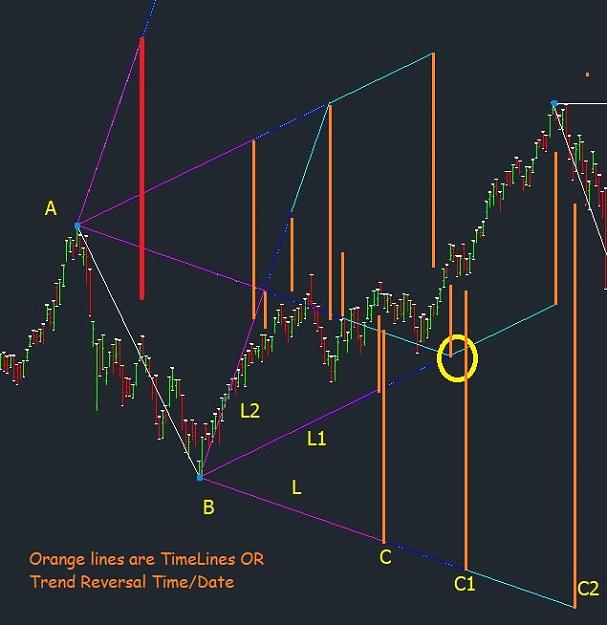
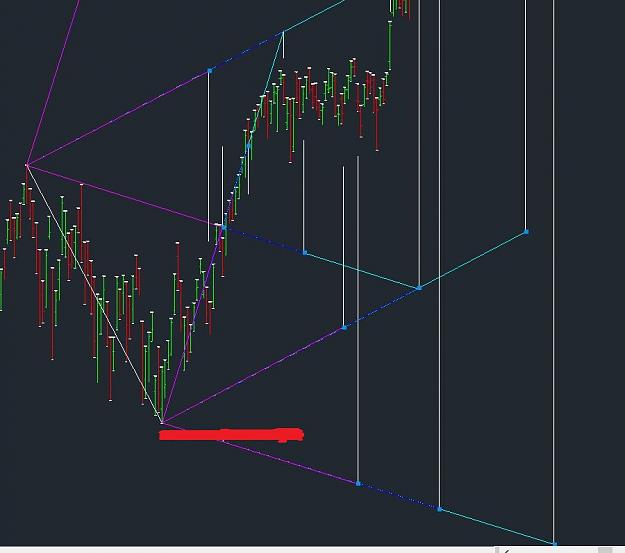
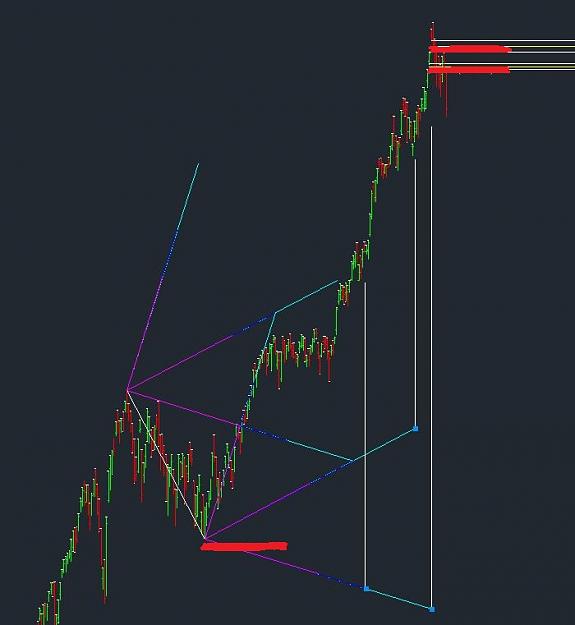
# You can also divide this ANS is 3 or 4 equal parts. Some of my stocks work well with a division of 3 and some with 4. The attached image works for both, 3 & 4.
# Also, you can extend the ANS twice or thrice.
Please see the attached image for a better understanding.
Regards
Now contributing one of mine. Honestly, I don't remember where do I get this from or is it my discovery...???
Well, that should not matter, credit will always be of the inventor...
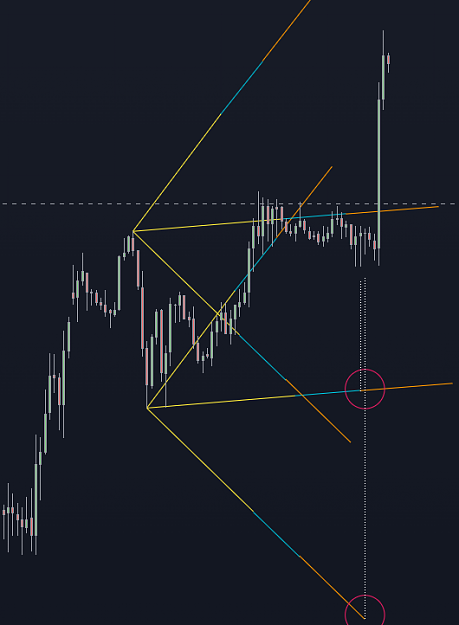
Explanation:
Take a significant swing. Calculate its length, from High (say Point A) to Low (say point B). Now multiply this by 0.707. Let's call this our ANS.
Now plot 2 horizontal lines from points A and B of length equal to ANS (i.e; Length of Swing * 0.707). The end of these lines gives trend reversal with +/- 1D.
It's that simple.
Here, we can take 0.618, 0.707, 1.414, and so on. Give it a try. I follow 0.707.
Some modifications:
# You can also divide this ANS is 3 or 4 equal parts. Some of my stocks work well with a division of 3 and some with 4. The attached image works for both, 3 & 4.
# Also, you can extend the ANS twice or thrice.
Please see the attached image for a better understanding.
Regards
Attached Image (click to enlarge)
5