In this thread I'll be doing some metals data analysis. I'll be upfront that the techniques I use would make my old stats professors cry so do your own due diligence before placing any trades based on what you see here.
Everyone is welcome to contribute analysis of their own. I'll also be taking requests if there's anything you're curious about!
Self-sufficiency is the greatest of all wealth. - Epicurus
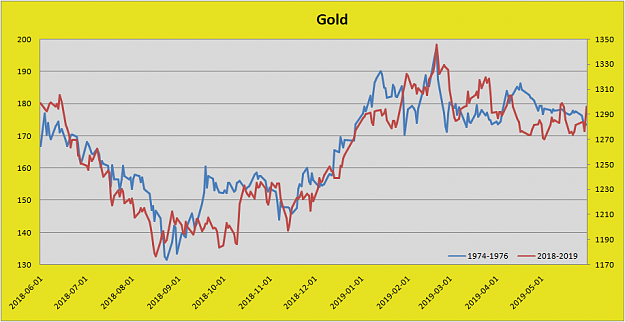
I'll get us started with an analog I created today for gold. Using data from the St. Louis Fed, I checked going back to 1968 to see what 12 month period had the highest correlation with the past 12 months ending on May 31st, 2019. I found that the 12 month period beginning on April 9th, 1974 had the best overall correlation at exactly 90%.
Attached Image (click to enlarge)
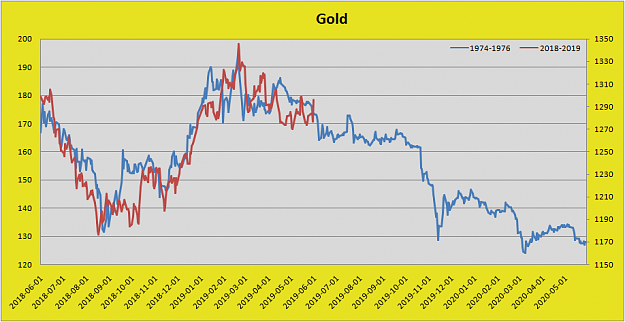
A 90% correlation isn't as high as I'd like to see for this type of study, but I think it lines up relatively well. So if the 70s are any guide, how do the next 12 months look? Like this:
Attached Image (click to enlarge)
Self-sufficiency is the greatest of all wealth. - Epicurus
Joined Dec 2015
|
Status: Member
|1,512 Posts|
Online Now
Hello EF5 I'm curious, why the St. Louis Fed? I'm unclear as to how that relates to Gold? Could it be that the St. Fed tracks also with the US Dollar, and that Gold is price in US dollars? Or is this a correlation that you have observed and are also unsure why this occurs? - Curious
Hello EF5 I'm curious, why the St. Louis Fed? I'm unclear as to how that relates to Gold? Could it be that the St. Fed tracks also with the
US Dollar, and that Gold is price in US dollars? Or is this a correlation that you have observed and are also unsure why this occurs? - Curious
Ignored
Sorry, I edited my post a little to clarify the analog is for gold prices. The St. Louis Fed is just where I'm getting the data from. Here's the data series: https://fred.stlouisfed.org/series/GOLDAMGBD228NLBM
The St. Louis Fed is one of the best data sources out there. They claim to have 566,000 data series and you can download all of into Excel.
Self-sufficiency is the greatest of all wealth. - Epicurus
Joined Dec 2015
|
Status: Member
|1,512 Posts|
Online Now
Ah...Ok. I get it. This is the London fix you are tracking. And I would assume you are comparing it to the NY close? Is that correct? I guess I am asking what you are correlating? Gold London to Gold NY? or NY Fed to Gold London? I get the numbers on the right side of your chart are the price of gold, but don't understand the numbers on the left side of the chart.
Ah...Ok. I get it. This is the London fix you are tracking. And I would assume you are comparing it to the NY close? Is that correct? I guess I am asking what you are correlating? Gold London to Gold NY? or NY Fed to Gold London? I get the numbers on the right side of your chart are the price of gold, but don't understand the numbers on the left side of the chart.
Ignored
I'm tracking the London fix through two time periods overlayed on the same chart. The first is 1974-1976 and the second is 2018-2019. The left side of the chart shows gold prices throughout the 1974-1976 period and the right side of the chart shows prices in 2018-2019... Gold sure has come a long way hasn't it? 170 to 1,300.
Self-sufficiency is the greatest of all wealth. - Epicurus
... Gold sure has come a long way hasn't it? 170 to 1,300.
Ignored
Price wise I would agree...but the chart listed here has me thinking about it really. I would appear nominal prices are just now catching up to inflation adjusted prices. This confluence makes me wonder if we're not due for even higher gold prices considering that historically nominal price has been below the inflation adjusted price for at least the last century. In other words the lack of inflation (by historic standards) ever since the large economic crisis in 2007 has allowed gold to not only increase its nominal value but also catch up with the inflation adjustment. AND since pretty much every major central bank in the WORLD is trying to kick up inflation again...Gold may be due for another leg up in the next few years.
... The first is 1974-1976 and the second is 2018-2019. The left side of the chart shows gold prices throughout the 1974-1976 period and the right side of the chart shows prices in 2018-2019...
Ignored
So if I read your comments correctly...and the 90% correlation between the two time frames...the forcast is for lower nominal prices over the next 12 months...is that correct?
I find this very interesting and in fact I took off 1/3 of my Gold position just thinking about this correlation. (Well it had made over 500 pips too!!) Interesting that fundamentals are seemingly pointing higher and your very logical observation is pointing lower...The question then becomes...continuance (lower) or divergence (higher). Now my head is spinning
{quote} Price wise I would agree...but the chart listed here has me thinking about it really. I would appear nominal prices are just now catching up to inflation adjusted prices. This confluence makes me wonder if we're not due for even higher gold prices considering that historically nominal price has been below the inflation adjusted price for at least the last century. In other words the lack of inflation (by historic standards) ever since the large economic crisis...
Ignored
Interesting chart! If I understand it correctly though, it's just demonstrating what the price of gold would have been historically if it were priced in 2018 dollars.
Self-sufficiency is the greatest of all wealth. - Epicurus
{quote} So if I read your comments correctly...and the 90% correlation between the two time frames...the forcast is for lower nominal prices over the next 12 months...is that correct?
Ignored
If the correlation holds it's true that we should expect lower prices in the next 12 months. Anything can happen though, especially with the current tenuous state of affairs in geopolitics, so I wouldn't place too much weight on it.
I find this very interesting and in fact I took off 1/3 of my Gold position just thinking about this correlation. (Well it had made over 500 pips too!!)
Ignored
Nice trade!
Self-sufficiency is the greatest of all wealth. - Epicurus
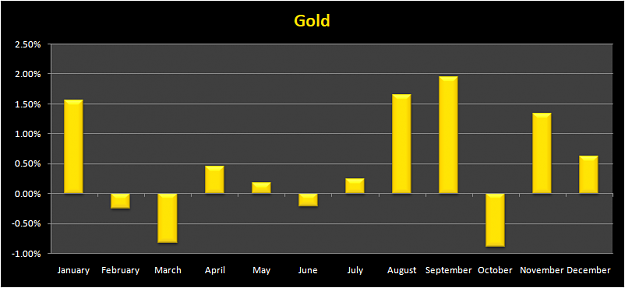
A lot of commodities traders like to use seasonal data for their trades so for my next study I decided to a create a seasonal chart for gold. Here's how it turned out:
Attached Image (click to enlarge)
Historically, August through January has been the best time to be long gold whereas February through July has been less directional.
Self-sufficiency is the greatest of all wealth. - Epicurus
A lot of commodities traders like to use seasonal data for their trades so for my next study I decided to a create a seasonal chart for gold. Here's how it turned out: {image} Historically, August through January has been the best time to be long gold whereas February through July has been less directional.
Ignored
Absolutely correct. Talking about specific months, January historically has best gold performance. June and July are average while September is worst!
{quote} Absolutely correct. Talking about specific months, January historically has best gold performance. June and July are average while September is worst! {image}
Ignored
Let's trade gold just on January?
In my opinion we should separate kind of traders. Investor traders, who trade on 4H and higher, can use the historical data, correlation and other, but simple treders(day traders, swing traders) don't need look at correlation, news or else - they have to learn charts and find pattern on it.
{quote} Let's trade gold just on January? In my opinion we should separate kind of traders. Investor traders, who trade on 4H and higher, can use the historical data, correlation and other, but simple treders(day traders, swing traders) don't need look at correlation, news or else - they have to learn charts and find pattern on it.
Ignored
I think having the knowledge of seasonality definitely helps for all kind of traders - Investor traders or simple traders.
For instance, if my charts are showing a buy signal in the month of January, I may open a large bullish position. However if they show a buy in September, I may just open a small position with a tight stop, being wary of historical September performance. On the other hand, I would go large short on a sell signal in September.
Joined Dec 2015
|
Status: Member
|1,512 Posts|
Online Now
I've never looked at seasonal charts and have no idea how to use them. In addition I have found most historical methods of trading to be most inaccurate as to timing and/or direction when it comes down to actionable methodology. I completely understand what you are saying here. I have just never been able to use it effectively.
I used to correspond with a trader who would trade gold by the phases of the moon. While on the surface that sounds a little "luney" he had good reason for his/her theory. It was based on eastern (India I think) religious practices where Gold is offered as part of the services. This would undoubtedly create a demand for gold for those who would be devout followers of these practices. And when I looked at the data it proved so...however again, the timing was difficult and often those with WAY more money that I, would spike prices to take stops just prior to the move.
I have since learned to read order flow/volume and follow that. This has improved my trading on all fronts, and kept me away from those little "disappointments"
If the correlation holds it's true that we should expect lower prices in the next 12 months. Anything can happen though, especially with the current tenuous state of affairs in geopolitics, so I wouldn't place too much weight on it.
Ignored
I will be watching this with great interest. I feel that 90% correlation is worth paying attention to. And if it give you a window on what the future might hold, I think its worth a look. As well, using my regular method to actionable entries will be very interesting to see how this develops.
Interesting chart! If I understand it correctly though, it's just demonstrating what the price of gold would have been historically if it were priced in 2018 dollars.
Ignored
That's how I look at it as well. However I also see it as the price of gold was below value because the USD (which gold is denominated) was over inflated. Of note for me was 1972 when Nixon took the US off the gold standard, and really inflated the crap out of the USD. I've read that this was because the US was the depository (safe keeping) for Gold during WWII, and that most European countries were wanting their gold back. Since the USD was (up to that point) anchored to Gold, or rather how much gold was kept in the US, returning all that European gold would've tanked the USD. So Nixon took the US off the gold standard.
It isn't until after this that the markets began their cycles of boom and bust, mostly due to central bank activity, trying to "control" inflation. Now, after nearly 50 years, the nominal value of gold and the value of the USD are where they should be. So the I expect the "geniuses" at the central bank to inflate the USD once again, thereby further reducing the purchasing power of the currency. Thus the nominal price of gold will need to rise again to catch up, and it may take another 50 years.
I've never looked at seasonal charts and have no idea how to use them. In addition I have found most historical methods of trading to be most inaccurate as to timing and/or direction when it comes down to actionable methodology. I completely understand what you are saying here. I have just never been able to use it effectively. I used to correspond with a trader who would trade gold by the phases of the moon. While on the surface that sounds a little "luney" he had good reason for his/her theory. It was based on eastern (India I think) religious...
Ignored
There's no shortage of pitfalls in looking at historical data. The way I use this is, I develop an idea of where asset prices should go based on the fundamentals and then look at data like this to ensure I don't get my timing wrong. Last August I was very bullish on equities and wanted to put on a big long-term position, but I thought do I really want to buy right before the two historically worst months of the year? I held off until scaled in slowly between November and January... My point is, trading is difficult and the greater confluence of factors going in your favor the better.
Self-sufficiency is the greatest of all wealth. - Epicurus
{quote} That's how I look at it as well. However I also see it as the price of gold was below value because the USD (which gold is denominated) was over inflated. Of note for me was 1972 when Nixon took the US off the gold standard, and really inflated the crap out of the USD. I've read that this was because the US was the depository (safe keeping) for Gold during WWII, and that most European countries were wanting their gold back. Since the USD was (up to that point) anchored to Gold, or rather how much gold was kept in the US, returning all that...
Ignored
It is remarkable how much the purchasing power of the dollar declined after Nixon took the US off the gold standard. There were a number of other inflationary factors at play though:
The 1973 and 1979 energy crises.
Unions were more common.
Demographics (baby boomer labor force.)
Long-term I think you're right that the prospect for gold is bullish. The next global recession is probably <2yrs away and things are going to get very dicey for the central banks. Even in a favorable scenario for the global economy, there's going to be a major money supply expansion which should be very bullish for gold.
Self-sufficiency is the greatest of all wealth. - Epicurus
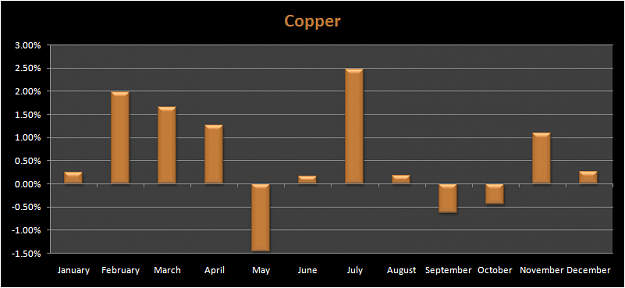
I constructed another seasonal chart tonight, this time for copper:
Attached Image (click to enlarge)
Going back to 1988, July has been the best month on average and May has been the worst. Unlike gold, we don't see any longer term trends where half the year was good and the other half bad.
Self-sufficiency is the greatest of all wealth. - Epicurus