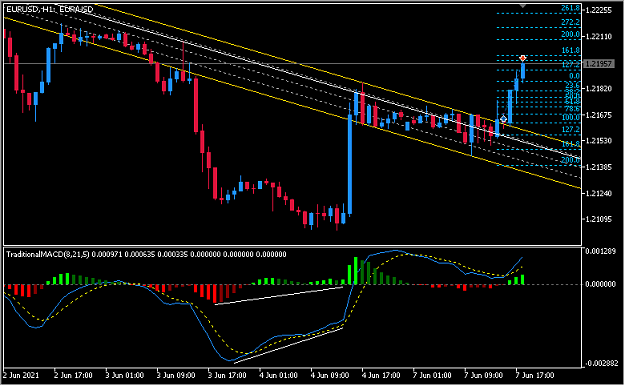
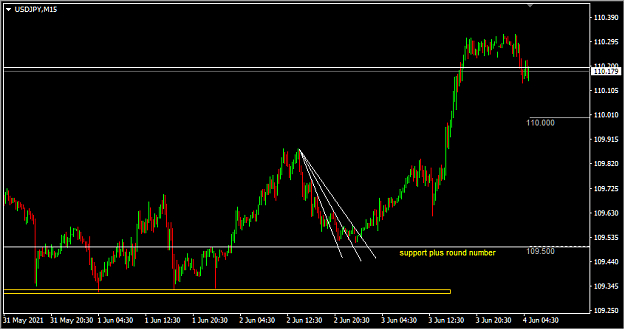
Disliked{quote} Viewing only that graph in m15 ... Less vertical angle of LT, width of the channel more proportionate to the bearish movement, engulfing candle close to round price, there are no touches to the LT between point 1 and 2. It will be interesting to know your opinion, as this is repeated many times before making a price turn.Ignored
if solely looking only at m15, some would like to have tight SL not mind trying again later on. the larger profit will cover the smaller loss.
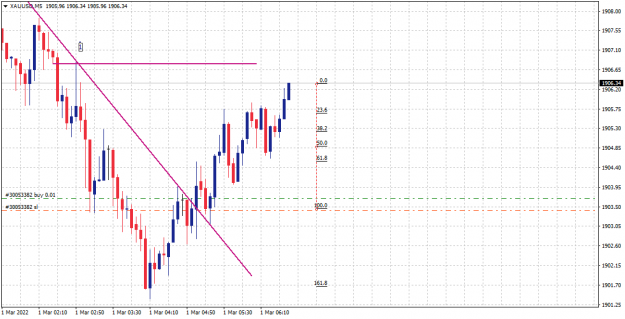
what i want to emphasize is to get as many confluence reasons as possible and checking the higher time frames.
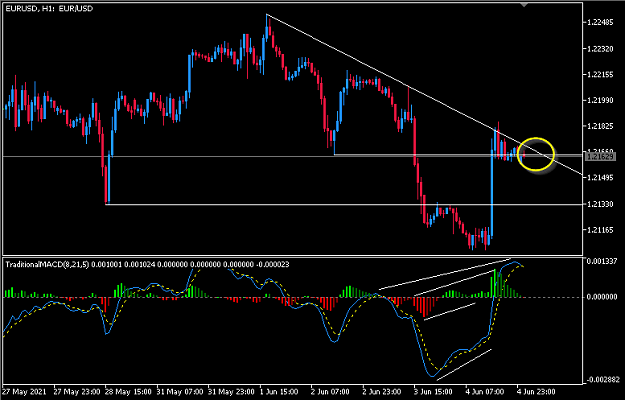
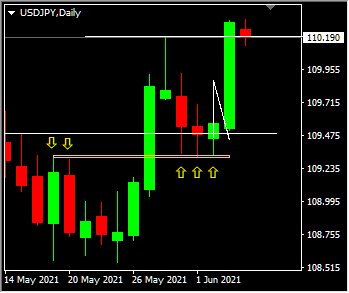
in this example, just by looking at W1 and D1 candles and drawing horizontal lines from their highs lows. Aren't they not support resistance in lower time frames?
one will see from W1 candle that there was a fake out.
now will see whether the top is a fake out after a period of testing.
it's the key level location that is more important rather than trading upon seeing every channel breakout.
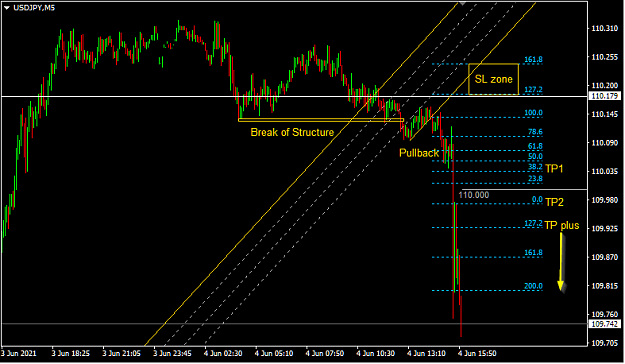
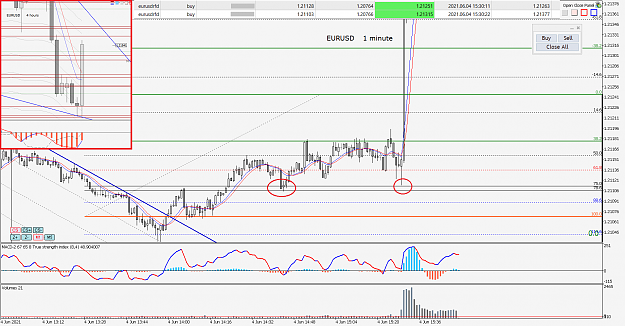
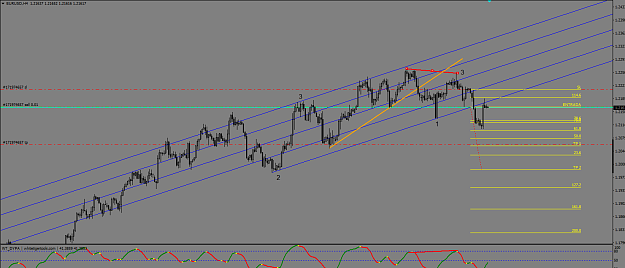
Attached Image (click to enlarge)
Attached Images

ITB - Seeing Orderliness amongst 'Randomness'
1