Hello,
I've been out of the Forex market and the Forex Factory community for quite a awhile now, and i will be honest to say i am not very much up to date.
A little more than a year back i was getting into machine learning and AI applied to Forex technical analysis, i will still dive deep into that and explore it further latter on. I've come to realize based on how many capable people there are, people with a very wide range of different knowledge and all the people with years and years of experience and study there are in the market, that, it's safe to assume that pretty much everything that can be tried, have been tried already by someone, be it by individuals or big corporations. So, we are not to be naive as to believe something miraculous will come out and get us our so long dreamed steady, reliable and profitable strategy, indicator or EA, especially for free, for a low cost, or if even get it, ever.
But, using me as an example, being very new to market and a newbie for sure with a very superficial overall knowledge.
We are dreamers still and want to find that little edge that will help us buy our coffee and our lunch at a decent restaurant at the very least.
Okay, so i was going through some of my developed EAs and Indicators and i thought i would share one of them here so you guys can have a look, try it out and if possible give your honest opinion and feed back.
About the indicator:
It's not based on any complex and advanced strategy or mathematical formula, to be honest it's pretty basic, simple and even random, so i will not defend any professional relevance or accuracy in regards to it.
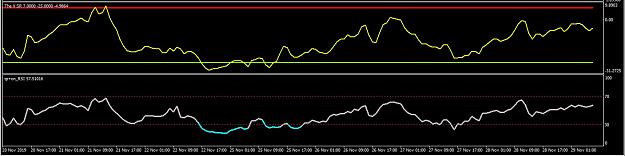
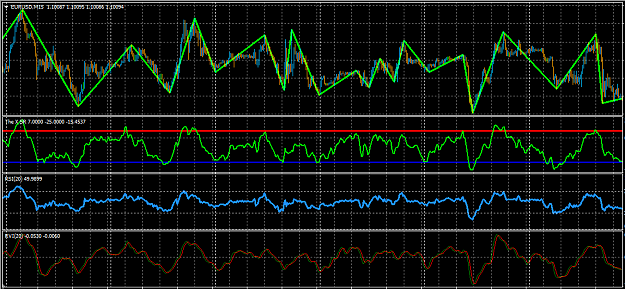
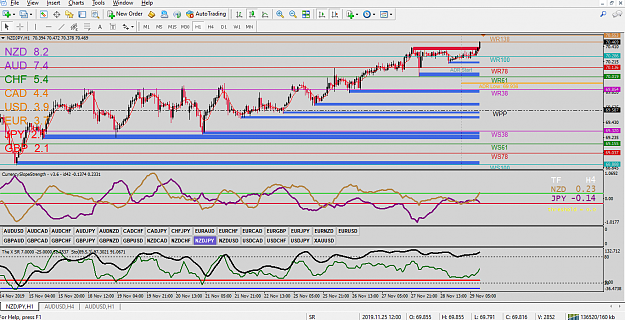
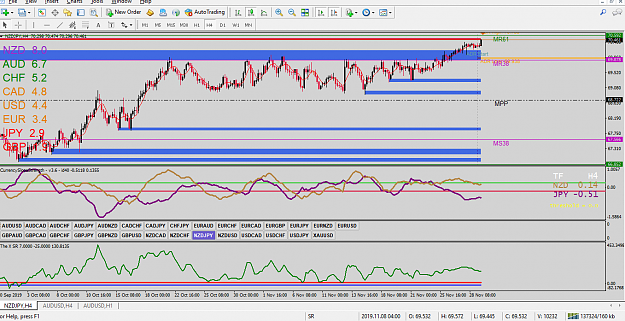
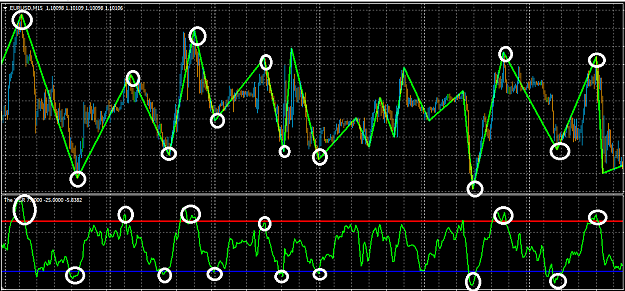
I coded it about a years ago and the idea was get all indicators with a range of minimum and maximum and normalize the values into one indicator, and what i found was pretty interesting. It does follow price movement very closely but in a very different proportion and range, so what i did was add a support and resistance line to the indicator, and in my point of view it gave some pretty decent indications of high and low peaks reacting to the S/R added to the indicator.
The support and resistance levels are customizable, and so is the period, and its very flexible to adjust to all time frames.
Giving that, i will share the indicator here, and i would like for you guys to play around with it and see if it has any value and comment on it's accuracy. Any adding ideas are welcome.
I had an EA for it at the time, but i didn't find it. i will code one. and if you guys like it or find any interest, i can share it here too.
My suggestion for configuring the indicator is define the period and the time frame (lower time frames seem to perform better), find the relevant high and low peaks and define the S/R based on that.
Hope and guys enjoy or it can be made to good use.
Good trading everybody. Look forward to your views.
I've been out of the Forex market and the Forex Factory community for quite a awhile now, and i will be honest to say i am not very much up to date.
A little more than a year back i was getting into machine learning and AI applied to Forex technical analysis, i will still dive deep into that and explore it further latter on. I've come to realize based on how many capable people there are, people with a very wide range of different knowledge and all the people with years and years of experience and study there are in the market, that, it's safe to assume that pretty much everything that can be tried, have been tried already by someone, be it by individuals or big corporations. So, we are not to be naive as to believe something miraculous will come out and get us our so long dreamed steady, reliable and profitable strategy, indicator or EA, especially for free, for a low cost, or if even get it, ever.
But, using me as an example, being very new to market and a newbie for sure with a very superficial overall knowledge.
We are dreamers still and want to find that little edge that will help us buy our coffee and our lunch at a decent restaurant at the very least.
Okay, so i was going through some of my developed EAs and Indicators and i thought i would share one of them here so you guys can have a look, try it out and if possible give your honest opinion and feed back.
About the indicator:
It's not based on any complex and advanced strategy or mathematical formula, to be honest it's pretty basic, simple and even random, so i will not defend any professional relevance or accuracy in regards to it.
I coded it about a years ago and the idea was get all indicators with a range of minimum and maximum and normalize the values into one indicator, and what i found was pretty interesting. It does follow price movement very closely but in a very different proportion and range, so what i did was add a support and resistance line to the indicator, and in my point of view it gave some pretty decent indications of high and low peaks reacting to the S/R added to the indicator.
The support and resistance levels are customizable, and so is the period, and its very flexible to adjust to all time frames.
Giving that, i will share the indicator here, and i would like for you guys to play around with it and see if it has any value and comment on it's accuracy. Any adding ideas are welcome.
I had an EA for it at the time, but i didn't find it. i will code one. and if you guys like it or find any interest, i can share it here too.
My suggestion for configuring the indicator is define the period and the time frame (lower time frames seem to perform better), find the relevant high and low peaks and define the S/R based on that.
Hope and guys enjoy or it can be made to good use.
Good trading everybody.
Attached Image (click to enlarge)
Attached File(s)