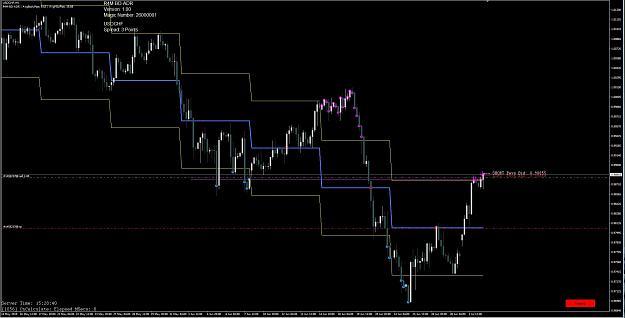
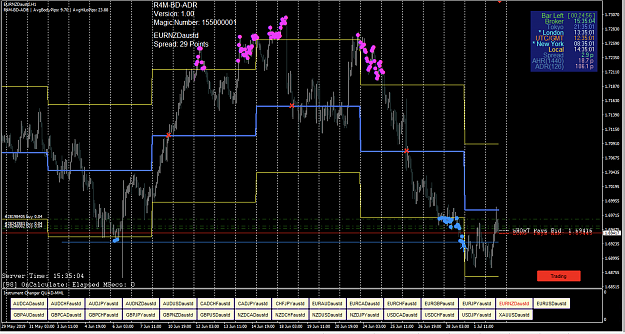
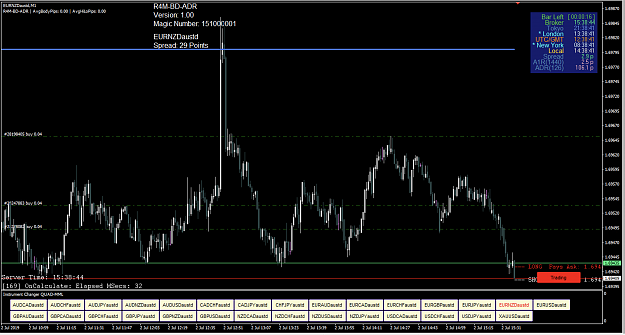
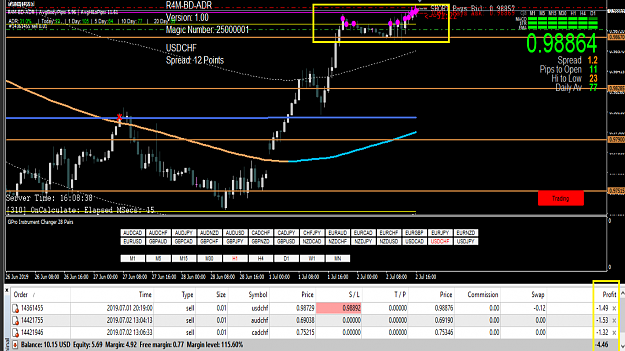
Putting this to the test on the H4, CHF looks like it needs to retrace across these 3 pairs, on a couple we are already into the second Dot, I have made the TP the current Blue line (I know it's dynamic), but making this the fixed TP will record it's current level moving forward and I can adjust the TP later.
Attached Image(s) (click to enlarge)
Some people say I'm lucky, but the more I practice the luckier I get
Putting this to the test on the H4, CHF looks like it needs to retrace across these 3 pairs, on a couple we are already into the second Dot, I have made the TP the current Blue line (I know it's dynamic), but making this the fixed TP will record it's current level moving forward and I can adjust the TP later. {image} {image} {image}
Ignored
Yeah. Way to go. But how would you manage that if you take several small positions across 28 pairs?
{quote} If you look at the picture, no bar has closed above the band. The signal must print only if the open of the bar is above the band. I marked the bar and the time left (31minuts before close of bar). The signal should print on the next bar if its open price is above the band. {image}
Ignored
@bishopdotun -- aaahhh -- perhaps our use of the word "signal" differs.
The blue and purple dots are NOT signals -- they are the "pre-signal" where the Close[0] (i.e. Ask) had reached above the band. Only if the subsequent Open is also above the band then it receives an Arrow. The Arrow is what I've been treating as the "Signal". Only the current bar should ever have an Arrow associated with it. An Arrow goes away at the beginning of the next bar.
The previous purple and blue dots may or may not have had an arrow when they were the current bar. They probably did, but not necessarily.
@bishopdotun -- I want to get this right according to your rules -- so, please, let's revisit the Entry instructions again and tell me again what visual cues you would like to see.
Why I need EA to monitor trades I would have closed the EN long trades as soon as the price pokes above the blue line. But I was busy attending to other stuff. {image} Then I zoomed to M1 to check what happened (see below). Clearly, a 10s timer would have taken me out. Price spent more than 10s above the line. {image}
Ignored
Quote
Disliked
Clearly, a 10s timer would have taken me out.
@bishopdotun -- the next tick would have also taken you out.
BTW -- I decided against using a timer. The indicator handles every tick that arrives.
{quote} @bishopdotun -- aaahhh -- perhaps our use of the word "signal" differs. The blue and purple dots are NOT signals -- they are the "pre-signal" where the Close[0] (i.e. Ask) had reached above the band. Only if the subsequent Open is also above the band then it receives an Arrow. The Arrow is what I've been treating as the "Signal". Only the current bar should ever have an Arrow associated with it. An Arrow goes away at the beginning of the next bar. The previous purple and blue dots may or may not have had an arrow when they were the current...
Ignored
Hey Steve,
Just want to mention that I have multiple arrows on my charts.
{quote} @bishopdotun -- aaahhh -- perhaps our use of the word "signal" differs. The blue and purple dots are NOT signals -- they are the "pre-signal" where the Close[0] (i.e. Ask) had reached above the band. Only if the subsequent Open is also above the band then it receives an Arrow. The Arrow is what I've been treating as the "Signal". Only the current bar should ever have an Arrow associated with it. An Arrow goes away at the beginning of the next bar. The previous purple and blue dots may or may not have had an arrow when they were the current...
Ignored
oh...yeah...
Sir, I get it now. I love what I am seeing at the moment. I don't want to clutter the screen or add anything.
You might consider printing the purple dot only after close of the candles above the line. Thus, the arrow become redundant and wont be needed. Otherwise, I like it as it is.
For exits, think about my last comment, I want out 1 or 2pips above the blueline. No delays. @Parisboy already explained how it aligned with the Centre of Gravity. And the price action around the area shows that.
Edit: Your last post solved the exit issue. However, the indi didn't print the exit. How am I sure it will send the instruction to the proxy EA?
{quote} {quote} @bishopdotun -- the next tick would have also taken you out. BTW -- I decided against using a timer. The indicator handles every tick that arrives.
{quote} ... Only if the subsequent Open is also above the band then it receives an Arrow. The Arrow is what I've been treating as the "Signal". Only the current bar should ever have an Arrow associated with it. An Arrow goes away at the beginning of the next bar. ...
Ignored
For manual trading, isn't it better to print arrow as Signal and keep it there instead of disappearing at the beginning of the next bar?
{quote} Yeah. Way to go. But how would you manage that if you take several small positions across 28 pairs?
Ignored
If I was trading 28 pairs I wouldn't be doing it manually that's for sure.
I have an EA that uses the Mean as both the TP/SL, but their is also a time SL, based on the average number of bars that a successful trade normally takes the revert back to the Mean, so the trades will close automatically if this time is exceeded.
The other thing it does when opening every additional trade (in the grid) is counts the number of pips from the current price to the Mean and if the original trade(s) are losing money it calculates their loss (based on the current Mean position being the dynamic TP) and then opens a lot size big enough to cover the loss of the original trade(s), should PA return to the Mean from its current level. It does this for every new trade until PA returns to the Mean or there is a Timeout SL.
Some people say I'm lucky, but the more I practice the luckier I get
{quote} oh...yeah... Sir, I get it now. I love what I am seeing at the moment. I don't want to clutter the screen or add anything. You might consider printing the purple dot only after close of the candles above the line. Thus, the arrow become redundant and wont be needed. Otherwise, I like it as it is. For exits, think about my last comment, I want out 1 or 2pips above the blueline. No delays. @Parisboy already explained how it aligned with the Centre of Gravity. And the price action around the area shows that.
Ignored
Quote
Disliked
You might consider printing the purple dot only after close of the candles above the line. Thus, the arrow become redundant and wont be needed. Otherwise, I like it as it is.
@bishopdotun -- a purple dot is drawn only after a Close is above a band. But we don't trade on Closes. Instead, we wait for the Open tick of the newest bar. If that tick is also above the band, then an Arrow is drawn. That is, an Arrow is associated with the Open tick of the newest bar.
There is always the possibility that a Close is above a band but the Open is below. In that case there would be a purple dot associated with the Close but no Arrow would appear. Using dots and an Arrow was my way of distinguishing between the Close of the previous candle and the Open of the current candle.
{quote} If I was trading 28 pairs I wouldn't be doing it manually that's for sure. I have an EA that uses the Mean as both the TP/SL, but their is also a time SL, based on the average number of bars that a successful trade normally takes the revert back to the Mean, so the trades will close automatically if this time is exceeded. The other thing it does when opening every additional trade (in the grid) is counts the number of pips from the current price to the Mean and if the original trade(s) are losing money it calculates their loss (based on...
Ignored
@Robot Trader -- thanks. And you're jumping the gun. We have to first learn to walk before we can run...
{quote} For manual trading, isn't it better to print arrow as Signal and keep it there instead of disappearing at the beginning of the next bar? Regards, Blackeagle
Ignored
@Blackeagle -- I'm following @bishopdotun's original description.
If the Arrows were to remain then you would have to look closely to see whether or not there was one over the current bar. With the current implementation, if you see an arrow then you know you had better get in your chair and start pressing BUY | SELL buttons.
The price surpassed ADR, but the unexpected result is that all three transactions above 100 pips. What should I do in this case? Escape to take a loss of 400 pips or continue to wait for reversal and fall according to the predicted strategy: the price will return to the middle of the center.
{quote} oh...yeah... Sir, I get it now. I love what I am seeing at the moment. I don't want to clutter the screen or add anything. You might consider printing the purple dot only after close of the candles above the line. Thus, the arrow become redundant and wont be needed. Otherwise, I like it as it is. For exits, think about my last comment, I want out 1 or 2pips above the blueline. No delays. @Parisboy already explained how it aligned with the Centre of Gravity. And the price action around the area shows that. Edit: Your last post solved the...
Ignored
Quote
Disliked
For exits, think about my last comment, I want out 1 or 2pips above the blueline. No delays.
@bishopdotun -- okay, hold that thought.
Let's get a stable v1 baseline version that works well in most people's hands and then it would be easy for us to gradually refine the indicator / EA by adding additional rules for Entry, Exit, Stop Loss, Take Profit, w/o sugar, w/o cream...
Appreciate your tireless efforts, mate. Although I am reading every post, I might have missed a couple of things, therefore I have the following questions:
1- Is it possible to add an option to turn "Short Pays Bid - Long Pays Ask" lines off? Do they serve a specific purpose?
2- I see "NAN_HorizontalLineSegment" object on my chart? How do we use it? Should it be visible on the chart? If not, is it possible to put an option to turn it off?