@takisd this would explain many strange entries and exits my expert advisors have taken lately...
Ignored
Brokers alter demo accounts by adding ticks or removing ticks near highs and lows. That is why traders who optimised EA set by back testing on a demo account will find it won’t provide the same results on live accounts on many occasions.
We just have to deal with it unfortunately.
Trading thin liquidity at the boundary of the charts
{quote} Brokers alter demo accounts by adding ticks or removing ticks near highs and lows. That is why traders who optimised EA set by back testing on a demo account will find it won’t provide the same results on live accounts on many occasions. We just have to deal with it unfortunately.
Ignored
With all due respect, I have been a broker, including CEO of 2 brokers for the last 15 years. I only stopped in march of 2020. You don't add or remove ticks in demo accounts, thats a waste of time and energy. This is a liquidity provider matter, they are amending the feed after the fact and it is not healthy for FTMO to accept it. The feed is slow, quite often when there is fast movement it delays the printing of the candle.
Demo accounts generally operate at full function with no anomalies, the reason being that there is no execution tech attached to them. Live accounts usually operate at a slight delay (in meta trader its 300ms) as there is a mt4 server -> bridge -> LP - > bridge -> Mt4 server message that occurs. But it doesn't slow the feed by a second and create wicks after the next bar has formed.
This is very much whoever provides the price feed is at fault.
I am a cheerleader for FTMO... But I want to show an example of why their LP is screwing their price feed up. They have like 500x more ticks than the market and that is used to mess around with price action and make traders react differently to price. I am not accusing FTMO of this, I do not think their set up is advanced enough to do this, but I am accusing their LP of this. You will see below two charts: 1) FTMO averages of which I used a color to show the average prices. Blue = bullish, pink = bearish (the one where the latest averages are showing...
Ignored
Youre only noticing this on indices? Or fx pairs as well?
{quote} With all due respect, I have been a broker, including CEO of 2 brokers for the last 15 years. I only stopped in march of 2020. You don't add or remove ticks in demo accounts, thats a waste of time and energy. This is a liquidity provider matter, they are amending the feed after the fact and it is not healthy for FTMO to accept it. The feed is slow, quite often when there is fast movement it delays the printing of the candle. Demo accounts generally operate at full function with no anomalies, the reason being that there is no execution tech...
Ignored
Hi Takisd
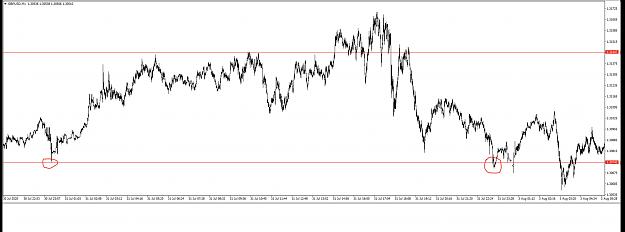
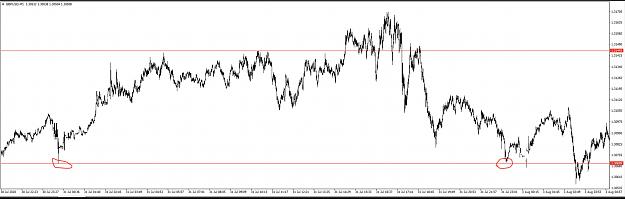
I can show you two pictures of two GBPUSD charts from IC Markets. One is a live chart showing lows below a resistance point and these candle wicks were the same on all servers on both MT4 and a Ctrader. The second chart is the IC Markets demo account from the MT4 tester using their demo account.
It clearly shows price short of the resistance zone which would create false entries for EA’s.
So we have two sources of data or one is changed - who’s at fault then?
Attached Image(s) (click to enlarge)
Trading thin liquidity at the boundary of the charts
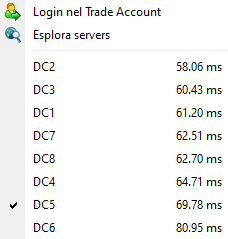
SERVER no connection for some time now. anybody else facing this ?
Ignored
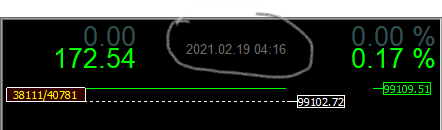
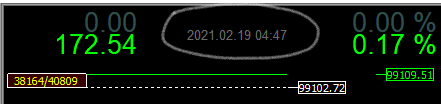
Stop from 04:16 CET Same thing yesterday afternoon.
It works out like this:
Needless to update the server request, you have to select a new one manually.
I have two platforms open. I've updated one now and it's ok.
The other is still standing because I haven't done anything yet (you can see from the timetable)
The image is from this time 04:44 CET
As I said, it also happened yesterday. Fortunately in times without open operations.
Am I wrong, or did Tomas confirm in his last reply that it happened last week too?
Once a month it can happen, 3-4 times or more in two weeks, it's not a good thing.
{quote} Hi Takisd I can show you two pictures of two GBPUSD charts from IC Markets. One is a live chart showing lows below a resistance point and these candle wicks were the same on all servers on both MT4 and a Ctrader. The second chart is the IC Markets demo account from the MT4 tester using their demo account. It clearly shows price short of the resistance zone which would create false entries for EA’s. So we have two sources of data or one is changed - who’s at fault then? {image} {image}
Ignored
Obv i can't speak for ic markets, all i know is they are an aggregator LP broker as well and their fills are built for pennies not big orders.
Its likely the demo represents the true price in this occasion, I'd have to cross check against my data.
{quote} Brokers alter demo accounts by adding ticks or removing ticks near highs and lows. That is why traders who optimised EA set by back testing on a demo account will find it won’t provide the same results on live accounts on many occasions. We just have to deal with it unfortunately.
Ignored
Confirm. As an example I have 2 accounts with ICMarkets. One is live and it has 5.5$ commission, second is demo and it is 7$. But despite the difference in commissions on January demo acc has earned approximately 20% more than live. Entry and exit prices are mostly better than on live.
I have contacted them and they said that demo has it's own server and some kind of average price, but live is live. So there can't be the same prices. It sounds logical and it will be strange if there will be no difference.
{quote} Confirm. I have 2 accounts with one well-known broker. One is live and it has 5.5$ commission, second is demo and it is 7$. On January demo acc has earned approximately 20% more than live. Entry and exit prices are mostly better than on live. I have contacted them and they said that demo has some kind of average price, but live is live. So there can't be the same prices and it sounds logical.
Ignored
this is possible that the demo feed is not the same as live in that it is an averaged feed. But I would be questioning the quality of the broker if thats the case. The two feeds should be the same, the only difference should be slippage on live vs demo in tht there is more slippage live as demo is infinite liquidity.
If the two feeds are different it means they are PAYING to have them different.
But I would be questioning the quality of the broker if thats the case.
Ignored
I just confirm RickM's post that there is a difference between live and demo. I have no complaints about the broker, and as a developer of big data systems I barely can imagine how you can make demo without any difference with live and the second question is what for and why.
{quote} I just confirm RickM's post that there is a difference between live and demo. I have no complaints about the broker, and as a developer of big data systems I barely can imagine how you can make demo without any difference with live and the second question is what for and why.
Ignored
in the multiple brokers I have run/worked for the demo price and live price + the feed including wicks and ticks were identical it was only execution that differed.. So for example, if you were using latency arb, maybe it would work on demo but it would never work on live due to slippage.
If a broker has two different prices for demo and live, then its nefarious in my opinion. I see no reason for it, it costs money.
{quote} Hi Takisd I can show you two pictures of two GBPUSD charts from IC Markets. One is a live chart showing lows below a resistance point and these candle wicks were the same on all servers on both MT4 and a Ctrader. The second chart is the IC Markets demo account from the MT4 tester using their demo account. It clearly shows price short of the resistance zone which would create false entries for EA’s. So we have two sources of data or one is changed - who’s at fault then? {image} {image}
Ignored
ic markets demo is the worst. i was testing a strategy on 1m and it lagged a ton
then again i;ve seen spreads open up and fuck everrything up on all brokers, pepperstone, icmarkets, fxcm,saxo
the one thing i like in ftmo is that the spread doesnt go too much.
they do show some indiferences on 4hr and daily so they kinda fuck up there but i either use different timeframe or check other brokes.
i do not trade indices so cant say anything about the problem takis is mentioning.
{quote} Hi Takisd I can show you two pictures of two GBPUSD charts from IC Markets. One is a live chart showing lows below a resistance point and these candle wicks were the same on all servers on both MT4 and a Ctrader. The second chart is the IC Markets demo account from the MT4 tester using their demo account. It clearly shows price short of the resistance zone which would create false entries for EA’s. So we have two sources of data or one is changed - who’s at fault then? {image} {image}
Ignored
Hey Rick, i'm not sure that's the best example. You do notice that both horizontal lines are not at the same price level?
the one where price breaks below and creates wicks is at 3074
the one where price doesn't reach or breach is at 30699. Move the horizontal line to the same as the other (3074) and the result is the same.
IC markets have terrible demo servers judging from complaints from traders of other prop firm, but this does not seem to be the case in this example. Or maybe i'm missing something..
Unless what you're trying to say is that an EA is responsible for drawing those support lines and the inefficient feed caused it to place the line at the wrong spot?
Joined Apr 2016
|
Status: Conquistadores'
|1,545 Posts
I wonder what it would take to revert back to the other instruments provided before this .cash thing. It's really a bad look.
Seems the problem is only prevalent on MT4. Same reason the youtube guy/FTMO trader Blake of VVS Academy, who trades mostly indices said he left MT4 and started using Ctrader and has been experiencing a lot less glitches/inconsistencies.
I wonder what it would take to revert back to the other instruments provided before this .cash thing. It's really a bad look. Seems the problem is only prevalent on MT4. Same reason the youtube guy/FTMO trader Blake of VVS Academy, who trades mostly indices said he left MT4 and started using Ctrader and has been experiencing a lot less glitches/inconsistencies. It had better not affect my dear forex pairs
Ignored
Unfortunately, the CTrader is done with me.
I started with this platform in 2012 and often, very often, encountered impossible and non-existent spikes on different terminals.
I gave this platform another chance last year, with another Broker. After so many years the same situation.
The data feed used by CTrader (all and in general), is completely different from that of MT4.
Consider that 99% of Traders are on MT4 and you get the point.
The best feed, cannot be on CTrader.
Also I refuse to do analysis on one platform and work on another. Just as I refuse to analyze with a Broker's data feed and operate with another.
I understand that perfection does not exist, but it would be nice to work with only one service. A Broker (company) and a data feed.
The amazing thing is that after more than 10 years, I find that the further we go, the worse the situation.
Is a point resolved? Three more become a problem.
And the thing seems endless.
Ps:
now, of course, everyone will say that they are very happy with the CTrader.
Well .... I'm happy for all of you.