You guys playing around it thatz good.Did you guys try to backtest with the data provided in excel sheet or directly trading it?
I have tried and result is very disappointing.
Fibonacchi value is does not derive the green zone value.
Second without gbp calc if you just use fibonacci calculator value for zone 1 and zone 6 for deciding buy or sell when red and yellow fibo value is different you will have lotz of bad trades in long run.Check for yourself dot get excited by just one day win.
Hi Strongtrade, You guys playing around it thatz good.Did you guys try to backtest with the data provided in excel sheet or directly trading it? I have tried and result is very disappointing. Fibonacchi value is does not derive the green zone value. Second without gbp calc if you just use fibonacci calculator value for zone 1 and zone 6 for deciding buy or sell when red and yellow fibo value is different you will have lotz of bad trades in long run.Check for yourself dot get excited by just one day win.
Ignored
Please do not get offended, but if you backtest it using different rules how could you expect to have better results?
Please do not get offended, but if you backtest it using different rules how could you expect to have better results?
Ignored
Hello Strongtrader,
Seems like you are very strong in english . In my post no where I have mentioned you will get better result.I just asked everybody to backtest it before using it.So that its getz cleared to them what you can expect.
I dot think you dot want to blow up your account
Trading is like business.Any strategy you are using you should do detail analysis.You can not use it just it like that. In demo trading ofcaurse you can do whatever you want.Money yours choice is yours.
According to me this strategy does not have enough power unless you get how gbp calc is derived.
Today I am not surprised because its a turn around tuesday trade.often time if you study chart if price baught strongly on monday the tuesday its getz sold off.That is why its sold of.If same thing happend on wednesday or thursday and if your open price in zone 1 or zone6 if plant for buy or sell you will definitely getz loss.Hope I am clear. Study history chart you will understand.
Did you backtest using the 3 signals, taking trades when two signals align ?
Ignored
Hi Niepce,
If red fibbo and yellow fibo give same signal .You dot have to look for any other thing.You can blindly can take the trade.
Problem arises when red and yellow both giving different signal.At that time we require third confirmation. For that we are using green zone(gbp calc) signal.Now according to the strong trader green zone derived from the fibo value which is mentioned in his earlier post(which is not true).If you use that as a third confirmation you will have lotz of bad trades.That makes strategy worst.
Green zone signal or third signal is only required when red fibbo and yellow fibbo value is different.Not every case.But we could not able to derive correct way to get this green zone value. You can see it on your own when you will back test it.
Hello Strongtrader, Seems like you are very strong in english . In my post no where I have mentioned you will get better result.I just asked everybody to backtest it before using it.So that its getz cleared to them what you can expect. I dot think you dot want to blow up your account Trading is like business.Any strategy you are using you should do detail analysis.You can not use it just it like that. In demo trading ofcaurse you can do whatever you want.Money yours choice is yours. According to me this strategy does not have enough...
Ignored
It seems we are strong equal in english. Anyway, jokes apart, the point is that you made your backtest using different rules so the results cannot be considered reliable. Please try to make a backtest using correct rules.
Prices do not rely on monday, tuesday or wensday etc, they rely on money flow that moves following cycles, then if you like to connect cycles to monday or tuesday or what other day of the week is just a matter of what you want to see in your charts. Everyone is free to trade the way he wants, everyone will take from the market what he wants to take and is responsible to himself.
It seems we are strong equal in english. Anyway, jokes apart, the point is that you made your backtest using different rules so the results cannot be considered reliable. Please try to make a backtest using correct rules. Prices do not rely on monday, tuesday or wensday etc, they rely on money flow that moves following cycles, then if you like to connect cycles to monday or tuesday or what other day of the week is just a matter of what you want to see in your charts. Everyone is free to trade the way he wants, everyone will take from the market...
Ignored
He Stongtrader,
You seems like not strong enough. Where do I mentioned that I back test with monday ,tuesday?????????????????????
Please read it carefully.I know how you derive third signal same way I used for deriving third signal.Why dot you try by yourself? without trying how you can predicting??????
With assumption and Prediction you can not trade and risk money. You require clear cut rule.
He Stongtrader, You seems like not strong enough. Where do I mentioned that I back test with monday ,tuesday????????????????????? Please read it carefully.I know how you derive third signal same way I used for deriving third signal.Why dot you try by yourself? without trying how you can predicting??????
Ignored
Bedayan, it seems we are playing a comedy of errors, my post was in two parts, one about backtest and one about your "history of chart"...anyway it's not worth for anyone to polemize.
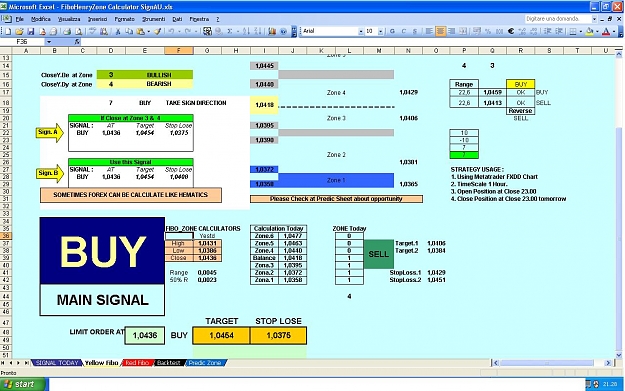
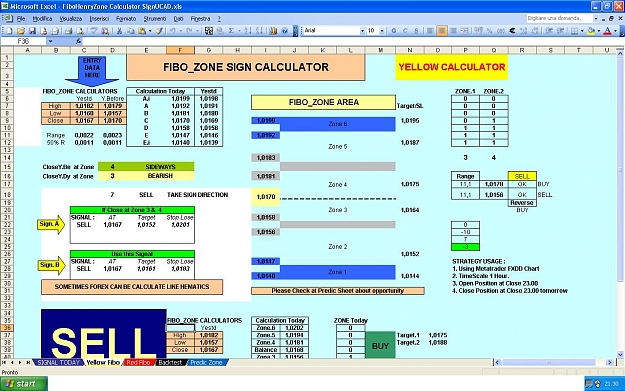
So for what I've understood till now green signal is not derived from fibo zones, I never said this...fibo zones are calculated the same way as for yellow and red. The difference is in HLC calculation. Now we have the fibocalc without password, so we can see all the calculation formulas, did you see anything worth for our purpose in it??
Bedayan, it seems we are playing a comedy of errors, my post was in two parts, one about backtest and one about your "history of chart"...anyway it's not worth for anyone to polemize. So for what I've understood till now green signal is not derived from fibo zones, I never said this...fibo zones are calculated the same way as for yellow and red. The difference is in HLC calculation. Now we have the fibocalc without password, so we can see all the calculation formulas, did you see anything worth for our purpose in it??
Ignored
I have tried to find out if there any calculation for green zone(gbp calc) but I did not find any.Your trade chart example does not explain anything.You just post the chart excel sheet calculation for that day thatz it nothing else.
You did not mention when both the signal different then what makes to take trade buy or sell? When you introducing any strategy you should be clear from your mind what is entry criteria, exit criteria, why I am taking the trade etc etc.
Atleast go back to back test sheet excel sheet show me couple of trade how could you have been taken the trade.
Bedayan, could you pls post the results of your backtest, so we can all take a sample of the days and check to make sure we have the same indication, and also see what price actually did. That would be very useful, save us from working out h/l/c for each day, instead focus on it qualitatively.
Based on yesterdays signals ( I only looked at EU and GU ).
I also use the indicator that plots the zones and also the s/r lines as mentioned in the pdf.
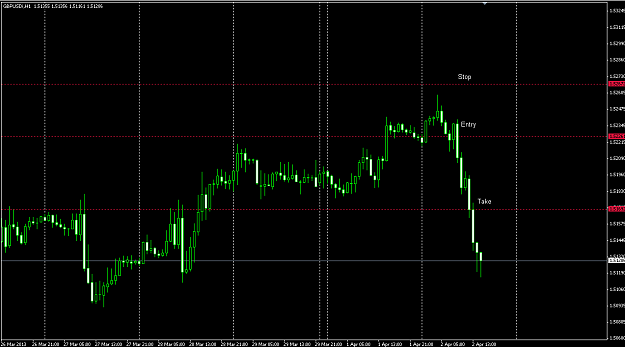
I think we are agreed that the indication was sell on both. In both cases, price went up initially, to bounce off Line D plotted by the indi for EU ( almost to the pip) and Line D plotted by the indi for GU ( going over it by 9 pips ). That is interesting. I guess the way to trade this then might be we use pending orders at the next such line / fibo zone from the open price. Sure, at times price might not get there, in which case you have no trade. But often it will. If it is anything like today, you have yourself a very tight s/l with an excellent r/r in your favour.
If you do this calculation for say 8-10 pairs, it would be interesting to see which ones get triggered and how many pips one would make over say a month.
I recall reading in the pdf that s/l was stated as just 9-10 pips.
TP can easily be upwards of 50 pips.
The advantage is that if price is consolidating, then it is unlikely to reach one of those areas, no trade is triggered, which is just as well.
Let me try to attach the indi for those who haven't got it.
I have tried to find out if there any calculation for green zone(gbp calc) but I did not find any.Your trade chart example does not explain anything.You just post the chart excel sheet calculation for that day thatz it nothing else. You did not mention when both the signal different then what makes to take trade buy or sell? When you introducing any strategy you should be clear from your mind what is entry criteria, exit criteria, why I am taking the trade etc etc. Atleast go back to back test sheet excel sheet show me couple of trade how could...
Ignored
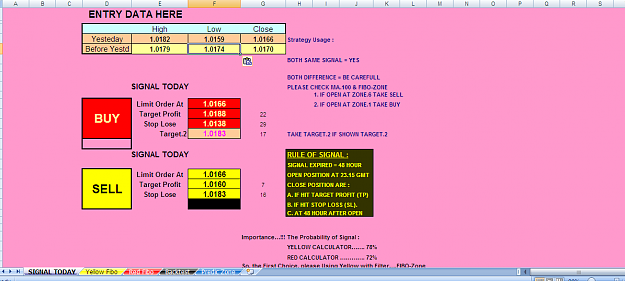
To recup: when yellow and red do not agree, take the one that agrees with green. This is the basic rule.
When I see that the extremes are far away from the open daily pivot (calculated at 23:00 pm gmt - this is important) I wait for price to get near the extreme (zone 1 or 6).
AS I said since the begining of this thread calc sheet is not a holy grail, is not a set and forget system, is not a strategy it's a tool. How I make my decisions trading is a matter of how I look at charts and of how I create my perspective, in other words is a matter of my trading method.
I do not even need to make a backtest, I can recognize when a signal is good or not just comparing with my way of trading, and as I'm using this tool since 3 months and I had only benefits from it till now, I can say so far so good...3 months are not a few, trading at least one signal per day per 4 pairs.
Said that I believe that this tool is very powerful and maybe the day we will know it perfectly it could be transformed in an auto-trading system too, who knows?
For now anyone can use this tool or not, it's a personal choise, a few people will understand its potential while many others will not, anyone will take from this thread what he wants to take; I'm not here to teach anything, I'm not claiming my results, I do not pretend nothing.
I just want to share something reliable with people that likes to improve it for my personal benefit and for their benefit...if you want to get something you have to give something, that's it.
Lets be positive and constructive, guys. Bedayan, could you pls post the results of your backtest, so we can all take a sample of the days and check to make sure we have the same indication, and also see what price actually did. That would be very useful, save us from working out h/l/c for each day, instead focus on it qualitatively. Based on yesterdays signals ( I only looked at EU and GU ). I also use the indicator that plots the zones and also the s/r lines as mentioned in the pdf. I think we are agreed that the indication was sell on both. In...
Lets be positive and constructive, guys. Bedayan, could you pls post the results of your backtest, so we can all take a sample of the days and check to make sure we have the same indication, and also see what price actually did. That would be very useful, save us from working out h/l/c for each day, instead focus on it qualitatively. Based on yesterdays signals ( I only looked at EU and GU ). I also use the indicator that plots the zones and also the s/r lines as mentioned in the pdf. I think we are agreed that the indication was sell on both. In...
Lets be positive and constructive, guys. Bedayan, could you pls post the results of your backtest, so we can all take a sample of the days and check to make sure we have the same indication, and also see what price actually did. That would be very useful, save us from working out h/l/c for each day, instead focus on it qualitatively. Based on yesterdays signals ( I only looked at EU and GU ). I also use the indicator that plots the zones and also the s/r lines as mentioned in the pdf. I think we are agreed that the indication was sell on both. In...
Ignored
glad you load it, but is the same you see on calc sheet...anyway having it on charts is ofcourse more comfy
Thank you for the pdf file. I think it is a very interesting. I don't understand the calculator though. I am going to reread the whole thread again and see if I can understand it from there. If not, maybe you can answer some questions.
glad you load it, but is the same you see on calc sheet...anyway having it on charts is ofcourse more comfy
Ignored
Hi Strongtrader,
Thanks for your fast reply.For price feed which broker platform you are using?I am using fxcm and because of that open,high low price is different signal for me calculating different.
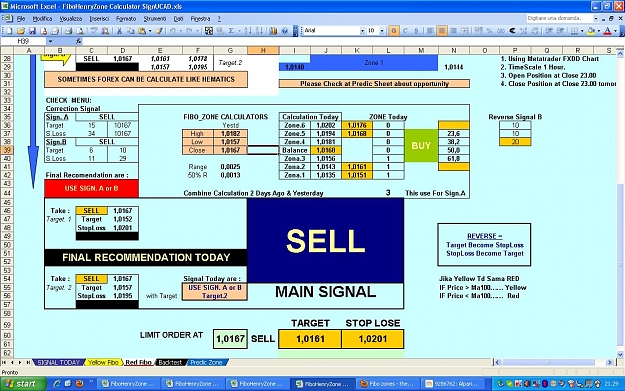
For your usdcad is double sell.
For me it was sell and buy.Based on this if I try to take the signal it could have been buy and my trade never going to be triggered.Please see below screenshot.