• Home
  • Forums
  • Trades
  • News
  • Calendar
  • Market
  • Brokers
  • Login
  • Join
  • User/Email: Password:
  • 5:49am
Menu
  • Forums
  • Trades
  • News
  • Calendar
  • Market
  • Brokers
  • Login
  • Join
  • 5:49am
Sister Sites
  • Metals Mine
  • Energy EXCH
  • Crypto Craft

Options

Bookmark Thread

First Page First Unread Last Page Last Post

Print Thread

Similar Threads

Camarilla Indicator wanted 6 replies

Add simple alert to Vwap/pvp indicator possible? 0 replies

Wanted : 'Dynamic Zone RSI' indicator 4 replies

Fibonacci channel indicator wanted. 5 replies

TD Indicator Wanted, Please 0 replies

  • Platform Tech
  • /
  • Reply to Thread
  • Subscribe
  • 6
Attachments: Wanted: PVP indicator
Exit Attachments
Tags: Wanted: PVP indicator
Cancel

Wanted: PVP indicator

  • Post #1
  • Quote
  • First Post: Oct 16, 2010 3:14pm Oct 16, 2010 3:14pm
  •  Slack
  • | Joined Aug 2009 | Status: Member | 649 Posts
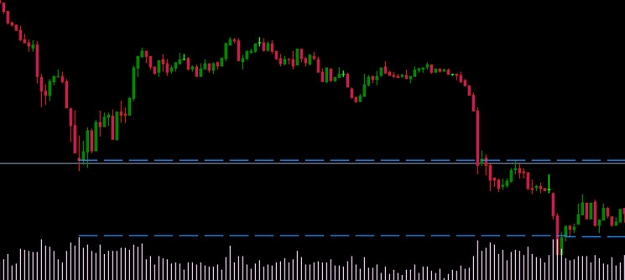
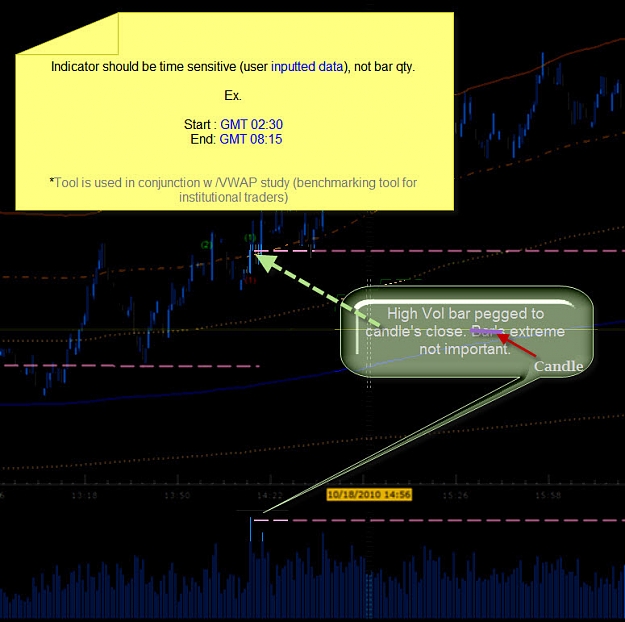
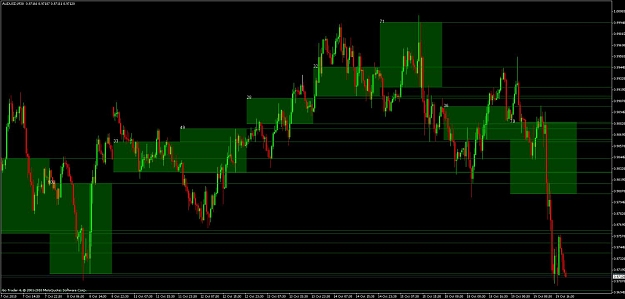
I've been searching, but no luck. Does anyone have a PVP (Peak Volume Price) indicator that draws a line at the close of a high volume bar for a specified time period?

Much appreciated if have and can share... thanks.
Attached Image (click to enlarge)
Click to Enlarge

Name: PVP.jpg
Size: 41 KB
  • Post #2
  • Quote
  • Oct 17, 2010 10:53am Oct 17, 2010 10:53am
  •  hayseed
  • Joined Nov 2006 | Status: Member | 3,603 Posts
hey slack..... can't recall seeing one.... neat idea.... if someone does not write it first, i will later.......h
to trade and code, keep both simple... no call to impress....h
 
 
  • Post #3
  • Quote
  • Oct 17, 2010 9:10pm Oct 17, 2010 9:10pm
  •  Slack
  • | Joined Aug 2009 | Status: Member | 649 Posts
Hey hayseed... thank you very much for the offer/post!
 
 
  • Post #4
  • Quote
  • Oct 17, 2010 10:58pm Oct 17, 2010 10:58pm
  •  hanover
  • Joined Sep 2006 | Status: ... | 8,092 Posts
I haven't seen one either. The nearest that I'm aware of are the indys attached to this post. I use my own variation of these to highlight possible climax-oriented reversal levels, and also S/R levels that are further confirmed by the highs/lows of prior climax candles. But I draw the horizontal lines manually.
 
 
  • Post #5
  • Quote
  • Oct 17, 2010 11:45pm Oct 17, 2010 11:45pm
  •  Slack
  • | Joined Aug 2009 | Status: Member | 649 Posts
Quoting hanover
Disliked
I haven't seen one either. The nearest that I'm aware of are the indys attached to this post. I use my own variation of these to highlight possible climax-oriented reversal levels, and also S/R levels that are further confirmed by the highs/lows of prior climax candles. But I draw the horizontal lines manually.
Ignored
I'm really surprised more traders haven't seen the correlation between high (relative) volume and S/R.
 
 
  • Post #6
  • Quote
  • Oct 18, 2010 1:17am Oct 18, 2010 1:17am
  •  hayseed
  • Joined Nov 2006 | Status: Member | 3,603 Posts
hey slack...... there may be some sort of correlation.... my trouble with trusting volume in forex has to do with what volume is in forex.....

actually it is only measuring ticks.... you could have volume,or ticks, with no trades being placed or the bid/ask changing....

it's true most of the time volume represents trading activity, but not always....

additionally, trading activity on one pair can effect yet another pairs volume, ie, raise it......

volume is basically a tick/ping/wakeupcall followed by changes in any of the marketinfo values and there are about 30 of them......


of course all that might solidify even more the correlation..... not sure.....h
to trade and code, keep both simple... no call to impress....h
 
 
  • Post #7
  • Quote
  • Edited 7:06pm Oct 18, 2010 1:30pm | Edited 7:06pm
  •  hayseed
  • Joined Nov 2006 | Status: Member | 3,603 Posts
hey slack..... here ya go..... lookback sets the bars to look back.....

give it a whirl and see if it works correctly.....h
Attached Image (click to enlarge)
Click to Enlarge

Name: slack.gif
Size: 21 KB
to trade and code, keep both simple... no call to impress....h
 
 
  • Post #8
  • Quote
  • Oct 18, 2010 2:09pm Oct 18, 2010 2:09pm
  •  Slack
  • | Joined Aug 2009 | Status: Member | 649 Posts
Dude, you kick ass!

A couple things, if I may:
Attached Image (click to enlarge)
Click to Enlarge

Name: Vol slack.jpg
Size: 120 KB
 
 
  • Post #9
  • Quote
  • Oct 18, 2010 9:42pm Oct 18, 2010 9:42pm
  •  hayseed
  • Joined Nov 2006 | Status: Member | 3,603 Posts
hey slack..... when times are introduced into anything, you would not believe how many questions come up..... gmt,server,broker,local,midnight and a gozillion others......

made changes to allow for user to set starttime and stoptime in 00:00 format......h
Attached Image (click to enlarge)
Click to Enlarge

Name: slack.jpg
Size: 209 KB
Attached File(s)
File Type: mq4 volume slack.mq4   4 KB | 589 downloads
to trade and code, keep both simple... no call to impress....h
 
 
  • Post #10
  • Quote
  • Oct 18, 2010 10:27pm Oct 18, 2010 10:27pm
  •  Slack
  • | Joined Aug 2009 | Status: Member | 649 Posts
Thank you very-very much, Hayseed!
 
 
  • Post #11
  • Quote
  • Edited 2:04pm Oct 19, 2010 1:48pm | Edited 2:04pm
  •  hanover
  • Joined Sep 2006 | Status: ... | 8,092 Posts
Quoting Slack
Disliked
Thank you very-very much, Hayseed!
Ignored
It was only after viewing Hayseed's solution that I suddenly realized that an indicator that I'd previously developed could be easily adapted to do this.

I won't be posting a third party audited CV to prove my programming experience (hope you share my irreverent sense of humor!), but if you want to try the indy in the above link:

Set LookbackDays to the number of days' candle highs/lows you'd like to see projected forward.

Set the TimeFrame parameter to blank

Set Properties to FTHE

Set StartHours and EndHours to the window across which you want the 'volume test' to be performed. Set ExtendHours to the point in time to which you want the lines to be projected. Or if you want the lines projected indefinitely to the RHE of the chart, set Properties to FTXE

Set TextProperties to blank, unless you want the number of pips between each pair lines to be displayed.

The rest of the parameters can probably be left as is. However, feel welcome to experiment. For example, and in keeping with the 'Better Volume' theme:

--- setting Properties to FTHR will select the highest range (instead of volume) candle

--- setting Properties to FTHM will select the biggest 'climax volume' candle (volume multiplied by range)

--- setting Properties to FTHD will select the biggest 'squat volume' candle (volume divided by range)

If you want to project multiple sessions' highs/lows forward, then simply attach multiple instances of the indicator (each with a different UniqueID setting).


@hayseed: sorry, I hope you're not too angry that I posted this, especially after the trouble that you went to.
Like I said, I suddenly realized that I had an indy that would do a similar job.


____________________

[EDIT] The screenshot below projects M30 climax volumes (Properties = FTXM) from the last 20 days forward --- a novel new idea for S/R?
Attached Image (click to enlarge)
Click to Enlarge

Name: slack1.jpg
Size: 106 KB
 
 
  • Post #12
  • Quote
  • Oct 19, 2010 3:00pm Oct 19, 2010 3:00pm
  •  hayseed
  • Joined Nov 2006 | Status: Member | 3,603 Posts
hey hanover.... just a little code, not much work..... always appreciate your posts and help......

....angry?.........me?.... ..... if you knew how laid back i am, you would have included the definition......h
to trade and code, keep both simple... no call to impress....h
 
 
  • Post #13
  • Quote
  • Oct 19, 2010 6:08pm Oct 19, 2010 6:08pm
  •  Slack
  • | Joined Aug 2009 | Status: Member | 649 Posts
Quoting hanover
Disliked
It was only after viewing Hayseed's solution that I suddenly realized that an indicator that I'd previously developed could be easily adapted to do this.

I won't be posting a third party audited CV to prove my programming experience (hope you share my irreverent sense of humor!), but if you want to try the indy in the above link:

Set LookbackDays to the number of days' candle highs/lows you'd like to see projected forward.

Set the TimeFrame parameter to blank...
Ignored
Very impressive, Hanover. I love the way you code -- leave no stone unturned.

My vol extreme theory: H vol close price represents the most significant price as opposed to other pivot S/R methods. We know the pros try to hide their intentions by icberging their orders into the market. Regardless, at some point, price is going to be pushed outside of a std deviation containment zone, i.e. trend, and volume can give us a clue of trend's intention.

We amateurs are looking for trends to jump into. Ironically, most of us wait until we are convinced (enough) of the trend to enter. More often than not, this is exactly at the end of the trend. All the amateurs, along with the last of the pro market orders, drive a final push that spikes volume.

Side bar: I was watching a training session from one of the major FX brokers and the instructor was mentioning how it is important to go thru the charts and look for best trending pair(s). He said to pick those pairs to trade and only in the direction of the major trend - go with the flow. I watched his video presentatio a couple weeks after the fact, so I opened the currency pairs he chose as good candidates. Funny thing, he picked the very bottom of the trends because they started reversing soon after his presentation

Morale of my story: Trends should be defined in terms of std deviation not visually. Trend ends/pauses should be defined in terms of std deviations + volume.
 
 
  • Post #14
  • Quote
  • Oct 20, 2010 5:54am Oct 20, 2010 5:54am
  •  hanover
  • Joined Sep 2006 | Status: ... | 8,092 Posts
Quoting Slack
Disliked
........the instructor was mentioning how it is important to go thru the charts and look for best trending pair(s). He said to pick those pairs to trade and only in the direction of the major trend - go with the flow........
Ignored
That's exactly the strategy that turned my trading around (albeit in demo) after more than 3 years of struggling. I wrote a strength indicator, and used it to pair the strongest currency/ies against the weakest, thereby trading the strongest, cleanest trends. On the daily/weekly/monthly TFs these supposedly have the backing of macroeconomic factors: carry trade; strengthening/weakening nation's economy; etc.

Combine this with a way of finding low risk intraday entries (I use S/R confluences and climax volumes on M15/M30), and there's usually plenty of opportunity to get a tightish SL to BE, a few of which then eventually result in really long moves. (Earlier this year when Greece was in crisis I managed a 47:1 RR trade using this approach. )

This strategy is similar to that outlined in the millipede thread.

Agree with you 100% about smart money determining the trend and dumb money blindly following, but too late. The trick is to somehow be able to anticipate potential reversal zones, without blindly guessing tops and bottoms. Again, I learned a lot from BRV's no-brainer trades, the VSA thread, and Sam Seiden's supply/demand techniques.

IMO an edge comes from an understanding of what's happening behind the candles, and why; only then is the validity of the edge reflected in the candles themselves, allowing certain patterns (in context) to be traded with some degree of justifiable confidence.
 
 
  • Post #15
  • Quote
  • Last Post: Oct 20, 2010 9:19am Oct 20, 2010 9:19am
  •  Slack
  • | Joined Aug 2009 | Status: Member | 649 Posts
Thanks for the links... (reading)
 
 
  • Platform Tech
  • /
  • Wanted: PVP indicator
  • Reply to Thread
0 traders viewing now
Top of Page
  • Facebook
  • Twitter
About FF
  • Mission
  • Products
  • User Guide
  • Media Kit
  • Blog
  • Contact
FF Products
  • Forums
  • Trades
  • Calendar
  • News
  • Market
  • Brokers
  • Trade Explorer
FF Website
  • Homepage
  • Search
  • Members
  • Report a Bug
Follow FF
  • Facebook
  • Twitter

FF Sister Sites:

  • Metals Mine
  • Energy EXCH
  • Crypto Craft

Forex Factory® is a brand of Fair Economy, Inc.

Terms of Service / ©2023