My stats above show that my average loser is -0.69R while my average winner is +1.65R.
In other words, my wins are 2x as big as my losers. Looking at my equity curve, I feel like I only had one big trade, but generally, where I've improved the most is managing losers better.
What I had to learn was that *background strength doesn't mean every test will succeed*. Background strength means the path of least resistance is higher, but if the buyers don't show up/more
supply arrives, then the markets are likely to go sideways/lower before a sustainable rally.
I heard someone say that "the market is a constantly updating probability machine" and I have learned to take that to heart. As I've gotten more chart-time, I've become more comfortable recognizing when a market is struggling. A struggling market doesn't negate the possibility of a breakout, but it does reduce it, and I use those odds to manage my risk.
Here's an example from a Spring I took yesterday that failed. The background was strong and I definitely had a bullish bias, but over time, I started to question the odds
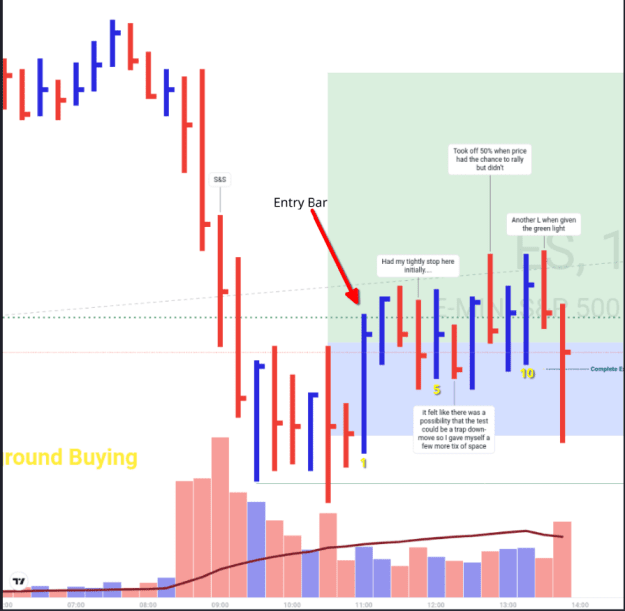
Background: There's buying in the background via the bar labeled S&S. This is followed by a Spring w/ accumulation at the low of the day.
Here is an example of how I mentally told myself a story of background strength, but started to lose faith in the rally for the time being once the markets failed to take advantage of clear opportunities
In other words, my wins are 2x as big as my losers. Looking at my equity curve, I feel like I only had one big trade, but generally, where I've improved the most is managing losers better.
What I had to learn was that *background strength doesn't mean every test will succeed*. Background strength means the path of least resistance is higher, but if the buyers don't show up/more
supply arrives, then the markets are likely to go sideways/lower before a sustainable rally.
I heard someone say that "the market is a constantly updating probability machine" and I have learned to take that to heart. As I've gotten more chart-time, I've become more comfortable recognizing when a market is struggling. A struggling market doesn't negate the possibility of a breakout, but it does reduce it, and I use those odds to manage my risk.
Here's an example from a Spring I took yesterday that failed. The background was strong and I definitely had a bullish bias, but over time, I started to question the odds
Attached Image (click to enlarge)
Background: There's buying in the background via the bar labeled S&S. This is followed by a Spring w/ accumulation at the low of the day.
Here is an example of how I mentally told myself a story of background strength, but started to lose faith in the rally for the time being once the markets failed to take advantage of clear opportunities
- I entered on the widespread blue bar labeled on the chart
- Hmmm volume has dried up instantly. My odds are looking sus but the background is strong, so I'll give it some space and hope things will resolve themselves higher
- Looks like a test bar, but price went above the prior bar as well. Most of the bar was lower than the prior close though, so it looks like a lack of supply
- It looks like bears might be gaining momentum but the bulls were still holding on. I tightened my stop to the low of this bar after the close
- Hmmm, that's odd. Another rally that goes nowhere.
- Ok this could be a test, so I moved my stop a little bit lower from #4 in case there was a shakeout -> move higher
- Shakeout -> move higher. Blue skies ahead for the bulls
- What happened to those blue skies? Price had a change to run, and ventured to new ground only to close back in the range. The odds of success are looking a lot lower now. I exited half my position on the close of this bar.
- Ok, solid response by the bulls, let's see what happens.
- Price retraced near the lows and closed on the highs. That's typically bullish, but it's another sign of bulls having blue skies ahead and refused to take advantage of it. Moved my stop up here to the dotted line on the far right near the #10
- Yet another time when price traded to new highs only to sell off
- Price breaks down and retraces deeply. Since I was actively managing my position, and updating my odds w/ new info, I lost a fraction of my initial risk
Even though the background strength was clear, the markets didn't take advantage of the test(s) and rally higher. Bar 12 imo was a bullish shakeout, so I actually jumped back into the markets again, but price continued sideways into the close.
On the surface, it's a random trade where I lost ~0.25R, but over time, being able to walk away w/ most of my initial stop is great because it does two things:
- Since I'm more in-tune w/ the market and less likely to lose my entire position every trade, I am less timid about entering a position and seeing what happens
- Since my losses are smaller, I can become overall profitable w/ smaller winners