Auto TrendChannels is a forex technical indicator for MT4 platforms. The indicator consists of three major lines – the channel lines, middle lines, and perspective projection lines (dotted lines).
The indicator automatically detects and plots the two parallel lines (channels) around several highs and lows with the accumulated price data. It considers 200 bars (by default) to determine the minimum price history of an asset to establish a trend channel.
How To Trade With The Auto TrendChannels Indicator
Just like trend lines, channels are traded in two major ways which are the bounce (reversal) strategy and the breakout and retest strategy. This is because the price can either reverse at the boundary of a channel or break it.
Bounce Trading
The boundaries of channels are potential turning points of price because they are dynamic support/resistance zones. A bounce on a channel boundary is a possible indication that the price is being rejected from moving further in that direction.
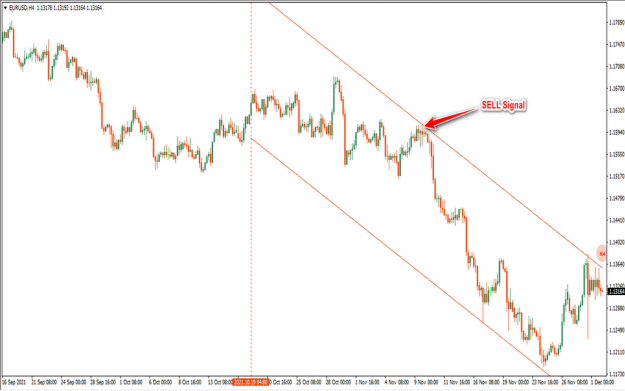
For a BUY setup, wait for the price to touch and bounce off the lower boundary of the (ascending) channel identified by the Auto TrendChannel indicator. A SELL setup is also established when the price touches and bounces off the upper boundary of the (descending) channel.
You may use price action to further filter out your entry for higher probability winnings. Take Profit should be ideally placed at the previous high/low on the channel or at the opposite end of the channel boundary.
Stop Loss on the other hand is discretionary to traders and their trading style. Nonetheless, your Stop Loss may be set a few pips above/below the channel boundary depending on the type of channel (ascending or descending).
Retest Trading
This trading strategy comes into play when an established channel boundary is broken by price. Before proceeding further, it is worth invoking one of the fundamental rules of support and resistance which is, support, when broken becomes resistance and vice-versa.
Therefore, when the boundary of an ascending channel is broken, it potentially becomes a support zone, for instance. Sometimes, the price tends to retrace back to retest the breakout zone before moving to the upside (breakout direction).
Thus, for a BUY setup, wait for the price to retest the broken region of the lower channel boundary with some degree of wick rejection (bounce). Similarly for a SELL setup, also wait for the price to retest the broken region of the upper channel boundary before going SHORT.
The idea behind the breakout and retest is to help you filter out false breakouts for optimal trade entries. This may in turn increase your trade efficiency with more winning rates than losses.
Auto TrendChannel Indicator Settings
The indicator comes with several basic parameters that can be customized by users.
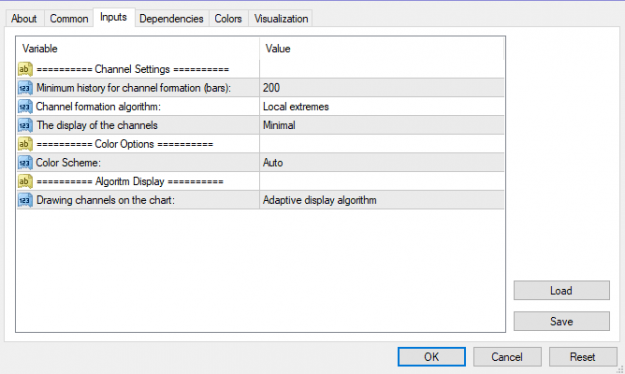
Minimum history for channel formation (bars) – this shows the minimum depth in bars used by the indicator.
Channel formation algorithm – this is used to define the extent of price extremes to be considered.
The display of the channels – value of the thickness line of the indicator.
Drawing channels on the chart – this parameter defines how a channel is drawn on the chart and how they appear in the relevant timeframes.
The Auto TrendChannels indicator is designed to automatically select a channel color that suits the background of the chart.
Conclusion
The Auto TrendChannels indicator is an invaluable trading tool that needs to be on your dashboard, especially if your trading style revolves around the trend channel. Finally, note that channels drawn on the higher time frames tend to be more reliable than those on the lower timeframes.
Indicator installation
Download Link
1. Download and unzip the archive to the MQL4 folder of the terminal;
2. Restart the terminal and run the indicator;
3. Allow import of DLLs.
The indicator automatically detects and plots the two parallel lines (channels) around several highs and lows with the accumulated price data. It considers 200 bars (by default) to determine the minimum price history of an asset to establish a trend channel.
How To Trade With The Auto TrendChannels Indicator
Just like trend lines, channels are traded in two major ways which are the bounce (reversal) strategy and the breakout and retest strategy. This is because the price can either reverse at the boundary of a channel or break it.
Bounce Trading
The boundaries of channels are potential turning points of price because they are dynamic support/resistance zones. A bounce on a channel boundary is a possible indication that the price is being rejected from moving further in that direction.
For a BUY setup, wait for the price to touch and bounce off the lower boundary of the (ascending) channel identified by the Auto TrendChannel indicator. A SELL setup is also established when the price touches and bounces off the upper boundary of the (descending) channel.
You may use price action to further filter out your entry for higher probability winnings. Take Profit should be ideally placed at the previous high/low on the channel or at the opposite end of the channel boundary.
Stop Loss on the other hand is discretionary to traders and their trading style. Nonetheless, your Stop Loss may be set a few pips above/below the channel boundary depending on the type of channel (ascending or descending).
Attached Image (click to enlarge)
Retest Trading
This trading strategy comes into play when an established channel boundary is broken by price. Before proceeding further, it is worth invoking one of the fundamental rules of support and resistance which is, support, when broken becomes resistance and vice-versa.
Therefore, when the boundary of an ascending channel is broken, it potentially becomes a support zone, for instance. Sometimes, the price tends to retrace back to retest the breakout zone before moving to the upside (breakout direction).
Thus, for a BUY setup, wait for the price to retest the broken region of the lower channel boundary with some degree of wick rejection (bounce). Similarly for a SELL setup, also wait for the price to retest the broken region of the upper channel boundary before going SHORT.
The idea behind the breakout and retest is to help you filter out false breakouts for optimal trade entries. This may in turn increase your trade efficiency with more winning rates than losses.
Auto TrendChannel Indicator Settings
The indicator comes with several basic parameters that can be customized by users.
Attached Image (click to enlarge)
Minimum history for channel formation (bars) – this shows the minimum depth in bars used by the indicator.
Channel formation algorithm – this is used to define the extent of price extremes to be considered.
The display of the channels – value of the thickness line of the indicator.
Drawing channels on the chart – this parameter defines how a channel is drawn on the chart and how they appear in the relevant timeframes.
The Auto TrendChannels indicator is designed to automatically select a channel color that suits the background of the chart.
Conclusion
The Auto TrendChannels indicator is an invaluable trading tool that needs to be on your dashboard, especially if your trading style revolves around the trend channel. Finally, note that channels drawn on the higher time frames tend to be more reliable than those on the lower timeframes.
Indicator installation
Download Link
1. Download and unzip the archive to the MQL4 folder of the terminal;
2. Restart the terminal and run the indicator;
3. Allow import of DLLs.