• Home
  • Forums
  • Trades
  • News
  • Calendar
  • Market
  • Brokers
  • Login
  • Join
  • User/Email: Password:
  • 6:48am
Menu
  • Forums
  • Trades
  • News
  • Calendar
  • Market
  • Brokers
  • Login
  • Join
  • 6:48am
Sister Sites
  • Metals Mine
  • Energy EXCH
  • Crypto Craft

Options

Bookmark Thread

First Page First Unread Last Page Last Post

Print Thread

Similar Threads

M candles / Custom candles for second charts 0 replies

Calculating only buy candles vs sell candles 2 replies

Risk, Money Management, Conflict of Interest...etc 6 replies

Implication of a conflict b/w Taiwan and Japan 3 replies

T/S and EA conflict help 0 replies

  • Trading Journals
  • /
  • Reply to Thread
  • Subscribe
  • 184
Attachments: Conflict Candles- Understanding PA
Exit Attachments

Conflict Candles- Understanding PA

  • Last Post
  •  
  • Page 1 23456 13
  • Page 1 234 13
  •  
  • Post #1
  • Quote
  • First Post: Edited Mar 11, 2021 2:39pm Feb 22, 2021 6:47am | Edited Mar 11, 2021 2:39pm
  •  Matts Micro
  • Joined Aug 2011 | Status: Member | 4,497 Posts
I intend to use this journal to build a new system I have named Conflict Candles.

It is basically PA reading but so far I have found incredible accuracy to read to the "right" side of the chart. I have just began, so there is much work to be done and there maybe ramblings of my thoughts as I try to figure out the finer points as I try to create the system.

First I need to clarify my terminologies: "Position" and "Action". In the market a "Long" is always a long and a "Short" is always a short. This is a "Position". However when you are "Buying" or "Selling" a trade, it is an "Action". What I mean is this: When you enter the market and "Buy" a "Long" you are buying that long from someone else. When you exit the trade you "Sell" that "Long" and someone else is buying that long from you. The same scenario exists for a "Short". So you enter the market and "Buy" a "Short" position from someone else and then when you exit the trade you "Sell" that "Short" to someone else. It is as you would imagine stocks, where the "Longs" are one stock and the "Sells" are another. They are two different entities, however they are in the same market and always are fighting for dominionship.

Conflict Candles
There are four types of Conflict Candles. By identifying the right candle in the right Scenario creates clarity of where the market is and what is going to happen next.
The Scenarios are:

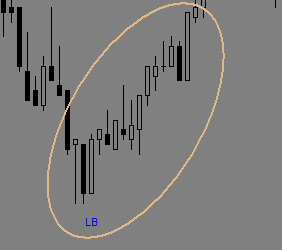
Long Buying (LB): This is a full throttle Candle move by the Bulls to move the market up. It is a positive move to the topside.
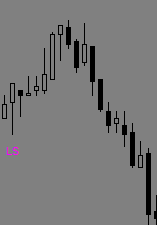
Long Selling (LS): This is a Candle of the Bulls exiting the market. It is considered a liquidation and potential for the bears to move in.
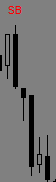
Short Buying (SB): This is a full throttle Candle move by the Bears to move the market down. It is a positive move to the downside.
Short Selling (SS): This is a Candle of the Bears exiting the market. It is considered a liquidation and potential for the Bulls to move in.


That's about it on the Introduction. This thread is going to be about how to read these candles and how to put the sequence of the conflict candles together. Not all candles are conflict candles but recognising these candles and how to put them together to understand the market is the purpose of this thread.


NB
A big thanks to Mr Pip. His thread and videos taught me about the market and charts. He taught me about Order Flow and the Harmonics of the market. His teachings are still my base reading of how the market flows and influenced many of my trade plans rules. If you want to start at the beginning and work through to becoming advanced, start here:
https://www.forexfactory.com/thread/...t-way-to-trade

He is in the commercial section of FF for reasons we can't fathom, I guarantee there is zero to sell on his thread or his You Tube channel.
Be sure to look him up on You Tube, his videos and live streams are educational and a great watch.
As the lights go by so too do the shadows move
  • Post #2
  • Quote
  • Feb 22, 2021 8:50am Feb 22, 2021 8:50am
  •  Matts Micro
  • Joined Aug 2011 | Status: Member | 4,497 Posts
Ok, this is what my typical chart looks like. It is a mapping of orders and where they lie. It is about trying to find the sentiment of the market. Basically you can see what the smart money does. So the objective is to be on the Smart money forefront.
Attached Image (click to enlarge)
Click to Enlarge

Name: eurusd 259.png
Size: 35 KB
As the lights go by so too do the shadows move
2
  • Post #3
  • Quote
  • Feb 22, 2021 9:11am Feb 22, 2021 9:11am
  •  spetscom
  • | Joined Jan 2019 | Status: Member | 175 Posts
Quoting Matts Micro
Disliked
I intend to use this journal to build a new system I have name Conflict Candles. It is basically PA reading but so far I have found incredible accuracy to read to the "right" side of the chart. I have just began, so there is much work to be done and there maybe ramblings of my thoughts as I try to figure out the finer points as I try to create the system. First I need to clarify my terminologies: "Position" and "Action". In the market a "Long" is always a long and a "Short" is always a short. This is a "Position". However when you are "Buying" or...
Ignored
If you'd like, we could try writing a program to backtest the candle idea extensively. I've got free time, send me a PM if you'd like to work together.
  • Post #4
  • Quote
  • Feb 22, 2021 9:14am Feb 22, 2021 9:14am
  •  Matts Micro
  • Joined Aug 2011 | Status: Member | 4,497 Posts
I will start the description of a "Short Sell" (SL) candle. It has a primarily bullish sentiment but caution is needed. The formation of the candle will be at the top of rising bullish candles and have a pullback tail or shadow.

What does it say. Bulls are pushing topside, the bears give up momentarily. So the "Shorts" have "Sold" their position (look at introduction for terminologies). This creates a momentary lapse in the bears defense creating a whip (tail) topside. The other Shorts in the trades step in and take up the slack bringing the price back.

From here the bulls know they have bloodied their enemy. They often step back while the other shorts try to Buy up the Shorts floating in the market. The bulls are happy to bring the price down a little to get a better price before bring the onslaught on again. This creates what I call Free Air.

In the Free Air one of two things happen. The Shorts can be happy for the released liquidity to add to their own positions or, there can be so much floating liquid unclaimed Shorts in the market that the bulls have a free reign to push harder stronger taking the price up.
Attached Image
As the lights go by so too do the shadows move
  • Post #5
  • Quote
  • Feb 22, 2021 9:18am Feb 22, 2021 9:18am
  •  Matts Micro
  • Joined Aug 2011 | Status: Member | 4,497 Posts
Quoting spetscom
Disliked
{quote} If you'd like, we could try writing a program to backtest the candle idea extensively. I've got free time, send me a PM if you'd like to work together.
Ignored
Hey Spetscom, Thanks mate I appreciate that and may take it up at some stage. At the moment I am just trying to get what's in my head on paper, so to speak. It may end up being nothing but I am confident I can create a system from it.

Cheers,
Matt.
As the lights go by so too do the shadows move
1
  • Post #6
  • Quote
  • Edited at 12:19pm Feb 22, 2021 12:04pm | Edited at 12:19pm
  •  Matts Micro
  • Joined Aug 2011 | Status: Member | 4,497 Posts
The next candle is the "Long Buy" (LB). The Long Buy is the Bulls primary weapon. It is a candle that pushes hard to the topside and will be followed by more Buying of Longs.

In this system the building of the candle is important to watch. Looking at history on the chart can be misleading. I am looking at the candle being built so I can see the strength of the momentum pushed into the particular candle. If it is jagged with fighting all the way this not a good signal. If the bulls push hard to start with and are able to hold with strength on to the new height they have achieved, then this is a good LB.

Even if the bears fight back the next candle this candle is already marked on the chart or "road map" and will be referenced by other Conflict Candles in the zone.
Attached Image
As the lights go by so too do the shadows move
  • Post #7
  • Quote
  • Feb 22, 2021 12:21pm Feb 22, 2021 12:21pm
  •  Matts Micro
  • Joined Aug 2011 | Status: Member | 4,497 Posts
I had an error on the introduction. The LS and SS were the wrong way around. Fixed now.
As the lights go by so too do the shadows move
  • Post #8
  • Quote
  • Feb 22, 2021 12:50pm Feb 22, 2021 12:50pm
  •  Matts Micro
  • Joined Aug 2011 | Status: Member | 4,497 Posts
Next is the "Long Sell" (LS). This is primarily a bearish sentiment but caution is needed. So just like Long Buy it has all the same characteristics except in a bearish state.

The Long sell is about the bulls giving up or reaching profit targets. There can be a slight further push with profit taking before the bears take over or the bulls may absorb the floating liquidity so that they can have a further push creating once again Free Air.

With these candles there is more than one explanation as to why they happen, the market isn't black and white (despite the colour of your charts). It is dependent on the previous conflict candles and the history of the road map, but I will get to that.
Attached Image
As the lights go by so too do the shadows move
  • Post #9
  • Quote
  • Feb 22, 2021 1:27pm Feb 22, 2021 1:27pm
  •  Matts Micro
  • Joined Aug 2011 | Status: Member | 4,497 Posts
The last Conflict Candle is the "Short Buy" (SB). The Short Buy is the primary weapon of the bears. It is the initial surge of the bears entering the market and is a candle of strength and usually followed by more Buying of Shorts (reminder to check the introduction for terminologies).

As with the LB the candle build is important to watch so the strength of the candle being built can be seen. If the candle crawls down in a staggered build, it means there is still balance in the price action and the Longs are still in the game and not a good SB. If the candle shoots down and holds its position it is a good SB.
Attached Image
As the lights go by so too do the shadows move
  • Post #10
  • Quote
  • Feb 22, 2021 1:43pm Feb 22, 2021 1:43pm
  •  Matts Micro
  • Joined Aug 2011 | Status: Member | 4,497 Posts
So now I have the an explanation of the four types of Conflict Candles the question is how do I identify them.

I remember when I was new to trading and I would be watching the charts and suddenly a big candle caught my eye and I would get all excited and hit the buy or sell button. I have found now that when I study the chart I still see the same candles but with more precision. When there is a high in the trend (for Longs) and a pullback of the candle occurs I tend to sit up and take notice, it is those candles I am watching.

At first it doesn't really matter too much where you find the Conflict Candles because as they get marked they all tend to lead to the same direction and decisions. "All roads lead to Rome".
As the lights go by so too do the shadows move
  • Post #11
  • Quote
  • Feb 22, 2021 1:54pm Feb 22, 2021 1:54pm
  •  Matts Micro
  • Joined Aug 2011 | Status: Member | 4,497 Posts
From here I think I will just provide a few examples so anybody looking at the thread can see what I am doing.

An important fact I haven't mention as of yet is that the marking of the Conflict Candles is done in real time and not done in a historic point of view.
Attached Image (click to enlarge)
Click to Enlarge

Name: eurusd 264.png
Size: 32 KB
As the lights go by so too do the shadows move
  • Post #12
  • Quote
  • Feb 23, 2021 9:22am Feb 23, 2021 9:22am
  •  Matts Micro
  • Joined Aug 2011 | Status: Member | 4,497 Posts
Another Chart. Don't mind the Fibonacci or TL's, it's just my trading strategy at work.
Attached Image (click to enlarge)
Click to Enlarge

Name: eurusd 273.png
Size: 50 KB
As the lights go by so too do the shadows move
  • Post #13
  • Quote
  • Feb 23, 2021 9:50am Feb 23, 2021 9:50am
  •  Matts Micro
  • Joined Aug 2011 | Status: Member | 4,497 Posts
The next part of the Conflict candles.


With each Conflict Candle there is a response by the market. Here is how I believe the market responds with each Conflict candle.

The arrows indicate the motion of the following candles after the Conflict Candle.
Attached Image
As the lights go by so too do the shadows move
  • Post #14
  • Quote
  • Feb 23, 2021 11:38am Feb 23, 2021 11:38am
  •  Matts Micro
  • Joined Aug 2011 | Status: Member | 4,497 Posts
Ok. Now I have all the basics on paper it's time to get into the fun part. Let's put it all together.
As the lights go by so too do the shadows move
  • Post #15
  • Quote
  • Feb 23, 2021 12:18pm Feb 23, 2021 12:18pm
  •  Matts Micro
  • Joined Aug 2011 | Status: Member | 4,497 Posts
This is a current chart. I have marked 4 recent interesting Conflict Candles. Within the current Price Action it tells a story.

From the bottom the Longs start Selling off their positions. This induces the other Longs in the market to pick up their orders.

The Shorts are happy to let the longs buy up again giving them a better position to sell from which happen a bit further up the chart.

The Longs Start Selling off again. This isn't marked on the chart. This is done on purpose. I have already marked the LS on the chart and it is now a permanent signal, meaning PA will follow this as a rule until another Conflict Candle takes over. I did however mark another one up further. This is put here for a purpose, to mark the level of structure this happens again at.

Up further the Short Buys kick in. Now this is an interesting combination. We have the Longs selling off positions and the Shorts buying up. This has one indication only. The Market is going down. The Price Action comes down and the Longs start Buying again. This is done I believe to release capital and create liquidity for the Shorts to have a stronger Buying position (remember terminology). The Short Buying begins again and look what happens (and further to go I believe).

This was marked all in real time and not as a historical factor. There would be no point if I cheated as it serves no purpose at all. Check Mr Pip's site here https://www.forexfactory.com/thread/...8#post13423608 as you can see I mark them as I go.
Attached Image (click to enlarge)
Click to Enlarge

Name: eurusd 275.png
Size: 48 KB
As the lights go by so too do the shadows move
  • Post #16
  • Quote
  • Feb 23, 2021 2:59pm Feb 23, 2021 2:59pm
  •  Matts Micro
  • Joined Aug 2011 | Status: Member | 4,497 Posts
I'm currently in a short. If you think you have a read on the Conflict Candles you may be able to read my trade. I am at traditional "support" but the bottom candle has made a "Long Sell". This means the support is collapsing with further fall to go.
Attached Image (click to enlarge)
Click to Enlarge

Name: eurusd 278.png
Size: 75 KB
As the lights go by so too do the shadows move
  • Post #17
  • Quote
  • Feb 23, 2021 3:45pm Feb 23, 2021 3:45pm
  •  Matts Micro
  • Joined Aug 2011 | Status: Member | 4,497 Posts
Here is the same chart (still in trade).

The yellow box is totally in play with all the Conflict Candles in play. I am reading what they are telling me.

The Support at the bottom has weakened with the LS.

However Longs have stepped in with a LB trying to win the market back.

This however is a move, I have found, used by the Smart money for the Dumb money to panic and exit their Shorts. This in turn creates liquidity for the Smart money to be able to fill their own Short positions for the market to head lower.... In theory
Attached Image (click to enlarge)
Click to Enlarge

Name: eurusd 280.png
Size: 65 KB
As the lights go by so too do the shadows move
  • Post #18
  • Quote
  • Feb 23, 2021 4:37pm Feb 23, 2021 4:37pm
  •  Matts Micro
  • Joined Aug 2011 | Status: Member | 4,497 Posts
Quoting Matts Micro
Disliked
Here is the same chart (still in trade). The yellow box is totally in play with all the Conflict Candles in play. I am reading what they are telling me. The Support at the bottom has weakened with the LS. However Longs have stepped in with a LB trying to win the market back. This however is a move, I have found, used by the Smart money for the Dumb money to panic and exit their Shorts. This in turn creates liquidity for the Smart money to be able to fill their own Short positions for the market to head lower.... In theory {image}
Ignored
So I read the chart from left to right and from top to bottom. I closed the trade so as to not lose pips in the market swap with spread. There may not be enough liquidity to get to my target profit taking zone so TS'd.

1 trade success, 99 to go before I get full confidence.
Attached Image (click to enlarge)
Click to Enlarge

Name: eurusd 281.png
Size: 52 KB
As the lights go by so too do the shadows move
  • Post #19
  • Quote
  • Feb 23, 2021 4:40pm Feb 23, 2021 4:40pm
  •  Matts Micro
  • Joined Aug 2011 | Status: Member | 4,497 Posts
Entry / Exit accuracy (remembering if more liquid I would expect a Lower Low).
Attached Image (click to enlarge)
Click to Enlarge

Name: eurusd 282.png
Size: 72 KB
As the lights go by so too do the shadows move
  • Post #20
  • Quote
  • Feb 24, 2021 7:37am Feb 24, 2021 7:37am
  •  Matts Micro
  • Joined Aug 2011 | Status: Member | 4,497 Posts
I just used Conflict Candles (CC) to confirm my entry at the structure my system says that PA will turn.

The SS says there is weakness for the Shorts. At the top with the SB candle I was still hesitant because of the SS. The LS on the next candle however was the confirmation that the Shorts were coming in for a serious go.

If I stayed my hand I may of got a better entry because the LS says PA will rise a little before the drop.
Attached Image (click to enlarge)
Click to Enlarge

Name: eurusd 284.png
Size: 63 KB
As the lights go by so too do the shadows move
  • Trading Journals
  • /
  • Conflict Candles- Understanding PA
  • Reply to Thread
    • Page 1 23456 13
    • Page 1 234 13
0 traders viewing now
  • More
Top of Page
  • Facebook
  • Twitter
About FF
  • Mission
  • Products
  • User Guide
  • Media Kit
  • Blog
  • Contact
FF Products
  • Forums
  • Trades
  • Calendar
  • News
  • Market
  • Brokers
  • Trade Explorer
FF Website
  • Homepage
  • Search
  • Members
  • Report a Bug
Follow FF
  • Facebook
  • Twitter

FF Sister Sites:

  • Metals Mine
  • Energy EXCH
  • Crypto Craft

Forex Factory® is a brand of Fair Economy, Inc.

Terms of Service / ©2021