Hey Winston, when you have a moment can you do a quick SD 101 on how you draw your boxes. Thanks
Ignored
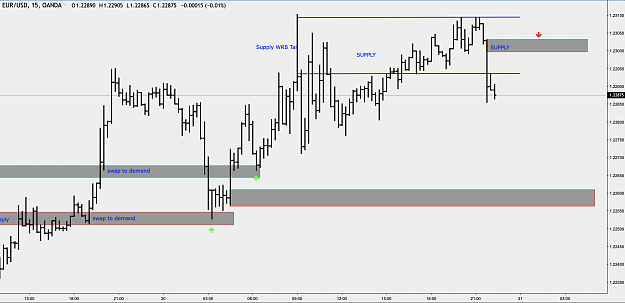
Check out the models on the first post. WRB bases usually but not always. A good look at my charts will help. If still question let me know and I'll do my best to clear it up. Trade on bro!
Joined Mar 2009
|
Status: Hobby Trader
|4,477 Posts
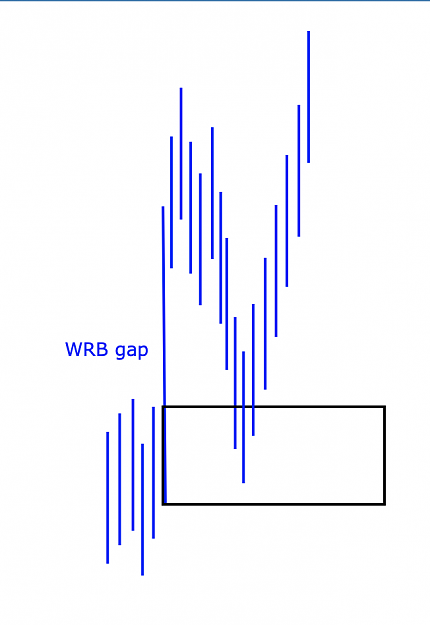
A clarification on differences between WRB and WRB gap.
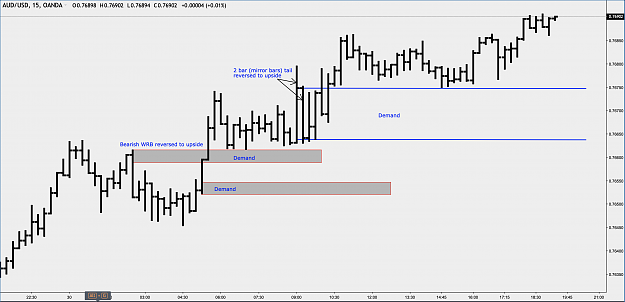
WRB = Wide Range Bar. A WRB is one that is significantly larger than the previous 3 bars.
WRB Gap = Same as WRB but there is a gap between the high/low of the bar previous to the WRB and the high/low of the bar after the WR.
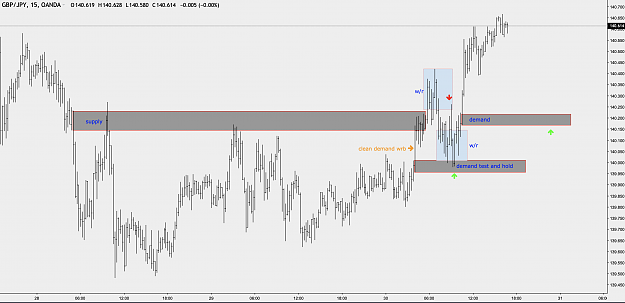
WRB Gaps are more significant and are often the origins of supply/demand.
Subscribed, but what happened to the previous recent thread you started?
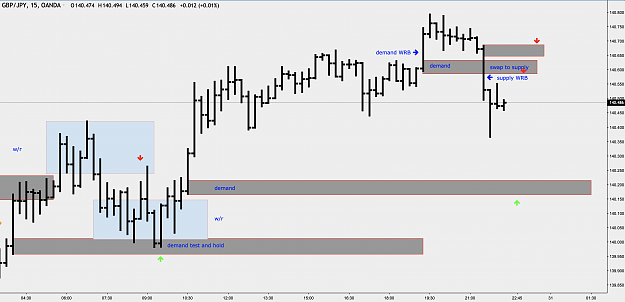
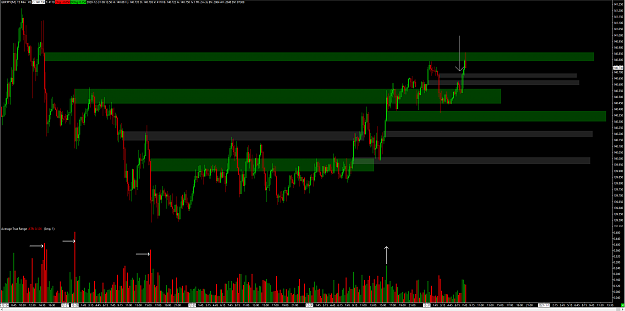
I zoomed out a bit more and combined your 2 charts from gbpjpy zones on one chart. The gray zones are yours and the green ones are the biggest WRB gaps (on the low of the chart you can see the ATR of 1 so it clearly shows the biggest bars). so the question is why you didn't draw those 4 green zones?
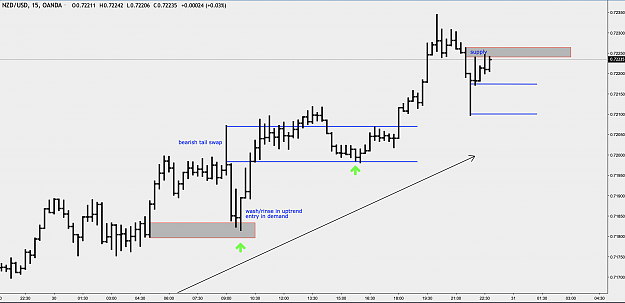
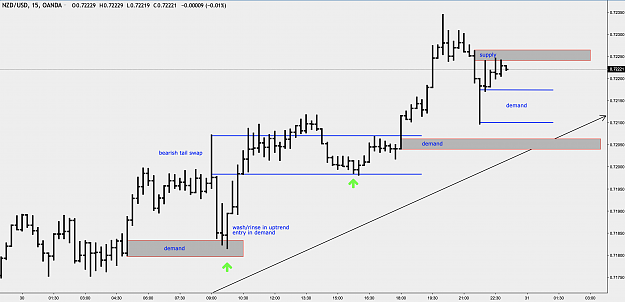
on the right side of chart you draw (post #8) swap to supply and supply zone in the uptrend when we keep making HH and HL, why so, you ignore the trend?