EDIT: The solution was that the Tick Date had a setting to offset the hour. Was set to -1.
Hi
I would be grateful for some help with an MA discrepancy.
I'm using the EMA5 Shift 2 and have added it to my tester template.
I'm runing statergy tester using Dukascopy tick data.
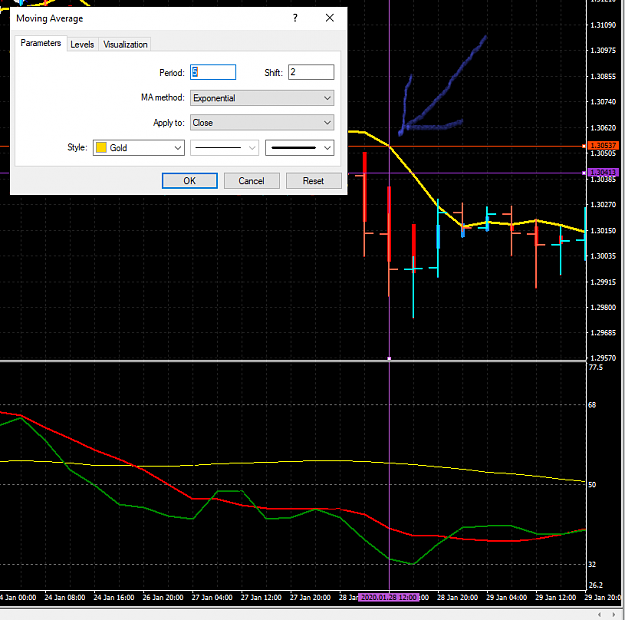
The image below shows the red line at 1.30537 which is the EMA5 S2 on the chart.
In my code Im using iMA() to generate the same value but it is different. The value is 1.30413 as shown by the purple line.
This difference is consistant with every bar.
The code I'm using is
This produces
0 11:37:50.118 2020.01.28 16:00:02 !TMS5-V1.04 GBPUSD,H4: Time:2020.01.28 12:00 EMA5S2_1:1.30413342 TimeFrame:0
This is the purple line. The parameters are exactly the same yet the values are different.
Can anyone suggest a reason and fix?
Just realised that the purple line value is the next bar value on the chart. Yet at 2020.01.28 16:00 i'm using 1 as the shift so that should be 2020.01.28 12:00.
Hi
I would be grateful for some help with an MA discrepancy.
I'm using the EMA5 Shift 2 and have added it to my tester template.
I'm runing statergy tester using Dukascopy tick data.
The image below shows the red line at 1.30537 which is the EMA5 S2 on the chart.
In my code Im using iMA() to generate the same value but it is different. The value is 1.30413 as shown by the purple line.
This difference is consistant with every bar.
The code I'm using is
Inserted Code
double EMA5S2_1 = iMA(NULL,TimeFrame,5,2,MODE_EMA,PRICE_CLOSE,1);
Print("Time:" + TimeToStr(iTime(NULL,TimeFrame,1)) + " EMA5S2_1:" + EMA5S2_1 + " TimeFrame:" + TimeFrame);
This produces
0 11:37:50.118 2020.01.28 16:00:02 !TMS5-V1.04 GBPUSD,H4: Time:2020.01.28 12:00 EMA5S2_1:1.30413342 TimeFrame:0
This is the purple line. The parameters are exactly the same yet the values are different.
Can anyone suggest a reason and fix?
Just realised that the purple line value is the next bar value on the chart. Yet at 2020.01.28 16:00 i'm using 1 as the shift so that should be 2020.01.28 12:00.
Attached Image (click to enlarge)