I have gone through with this forum
and i have collected many good trading strategies
How ever with my experience and how i like to trade
is shown below
if anyone can make me an EA or INDICATOR BASED ON THIS STRATEGY IT WILL BE NICE {REQUEST}
TIMEFRAME H1
PAIR ANY *AUD USD NZD USD GBP USD AND JPY BASED PAIRS WILL WORK GOOD
INDICATOR
MOVING AVERAGE 5 EMA 12 EMA 20SMA(AKA MIDDLE BB BAND)
MACD 4,10,1
RSI 21 Level 50
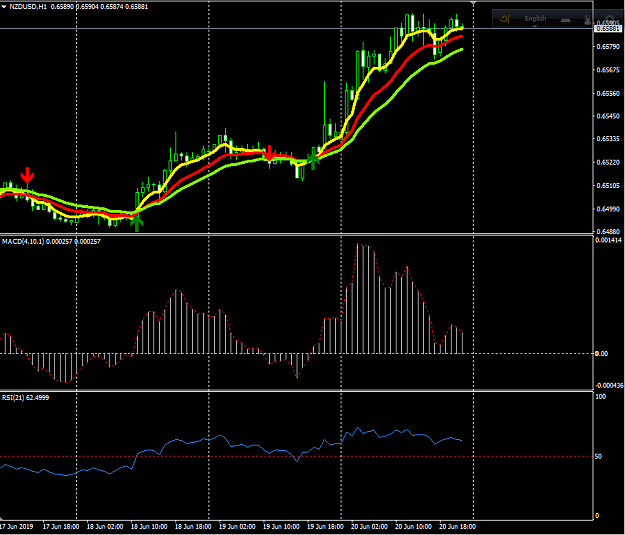
BUY SIGNAL
When Price cross 20 SMA and watch out the price action candle and if 5 ema cross 12 ema its good..
MACD HISTOGRAM GOES POSITIVE FROM NEGATIVE
RSI 21 IS ABOVE 50 LEVEL OR CROSSING
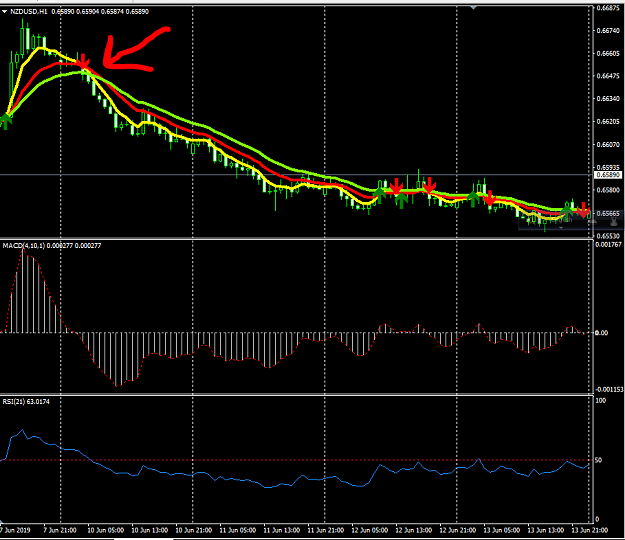
SEll Signal
When price cross 20 SMA below watch out the price action candle and if 5 ema cross 12 ema its good
MACD histogram goes negative from positive.
RSI 21 is belove 50 level or just crossed
and i have collected many good trading strategies
How ever with my experience and how i like to trade
is shown below
if anyone can make me an EA or INDICATOR BASED ON THIS STRATEGY IT WILL BE NICE {REQUEST}
TIMEFRAME H1
PAIR ANY *AUD USD NZD USD GBP USD AND JPY BASED PAIRS WILL WORK GOOD
INDICATOR
MOVING AVERAGE 5 EMA 12 EMA 20SMA(AKA MIDDLE BB BAND)
MACD 4,10,1
RSI 21 Level 50
BUY SIGNAL
When Price cross 20 SMA and watch out the price action candle and if 5 ema cross 12 ema its good..
MACD HISTOGRAM GOES POSITIVE FROM NEGATIVE
RSI 21 IS ABOVE 50 LEVEL OR CROSSING
SEll Signal
When price cross 20 SMA below watch out the price action candle and if 5 ema cross 12 ema its good
MACD histogram goes negative from positive.
RSI 21 is belove 50 level or just crossed
Attached Image(s) (click to enlarge)