This post is in continuation of my trading strategy posted here : https://www.forexfactory.com/showthr...69#post9221169
Ok So focus primarily on trading divergences, Being that early on in my trading career I identified an algorithm hidden within ' All Oscillators ' going by one simple rule
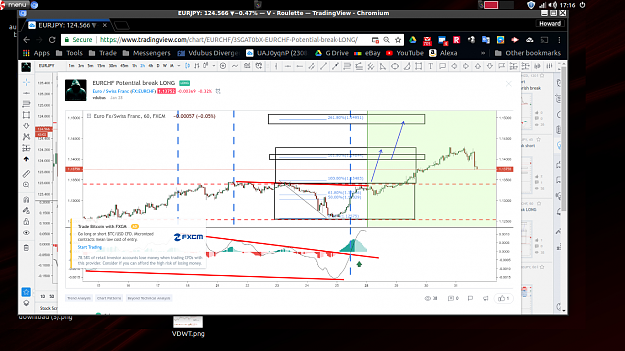
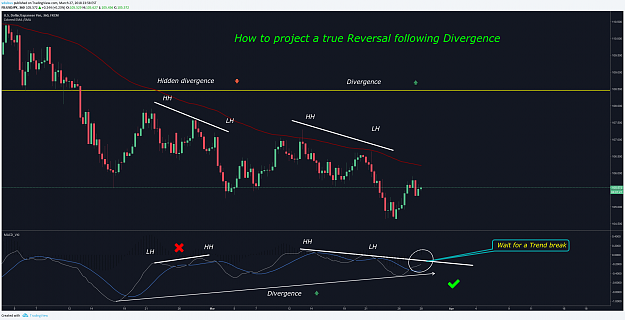
- Divergence Projects the next trend break & or reversal. ( Please refer to my previous post above )
It wasn't until recently I paid no attention what so ever to the histogram of the MacD. I saw this as unreliable... Until now.
We all are pretty much familiar with divergence & hidden divergence but nothing in true relation to price pattern formations.
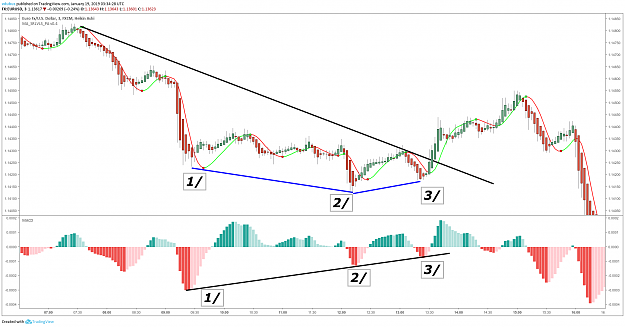
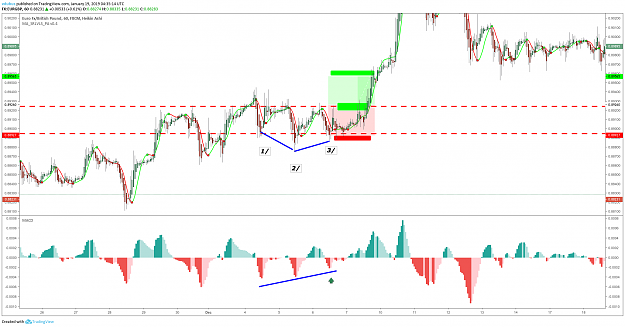
The rules are simple:
Follow the money !
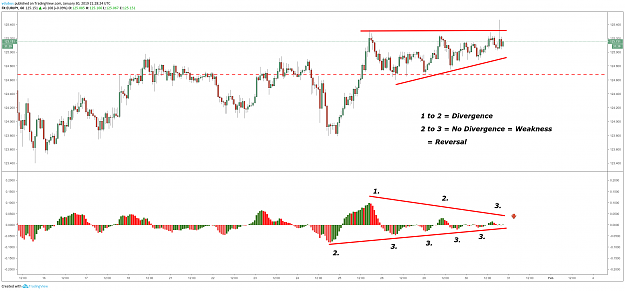
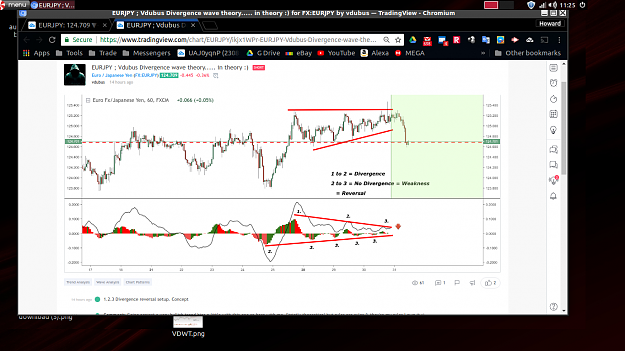
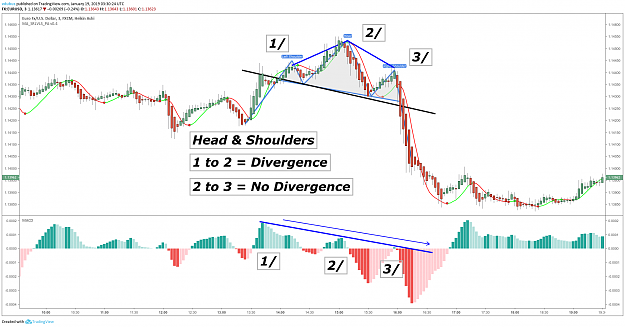
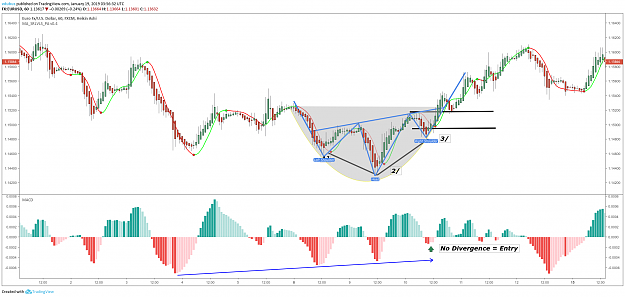
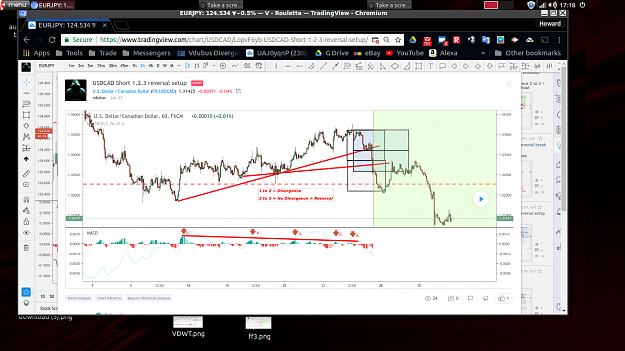
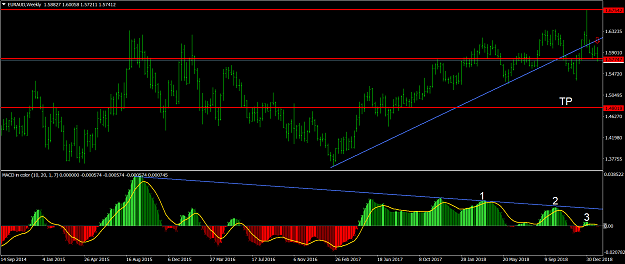
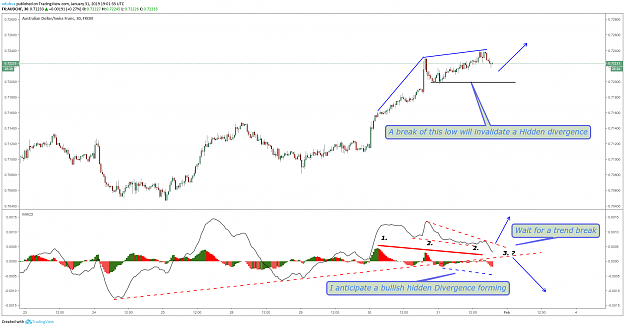
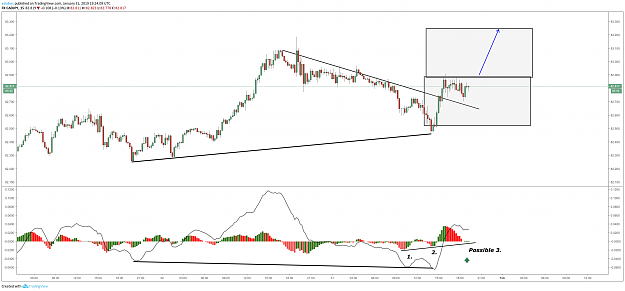
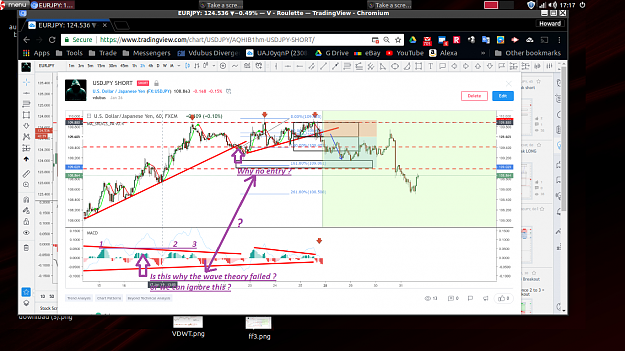
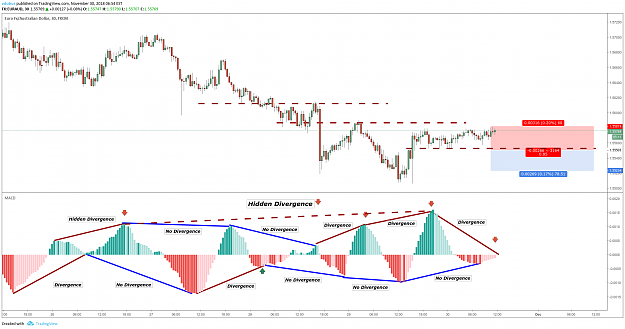
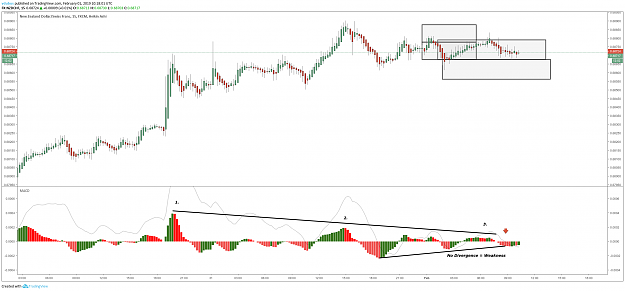
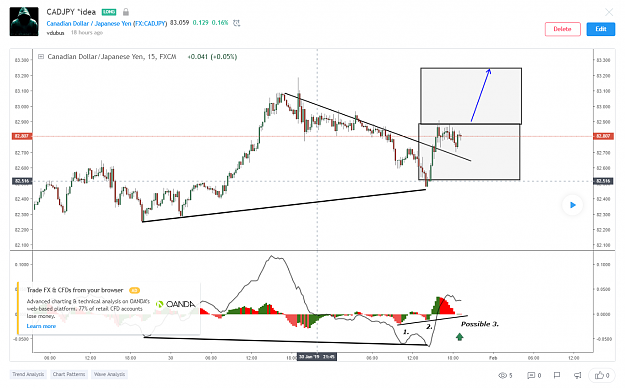
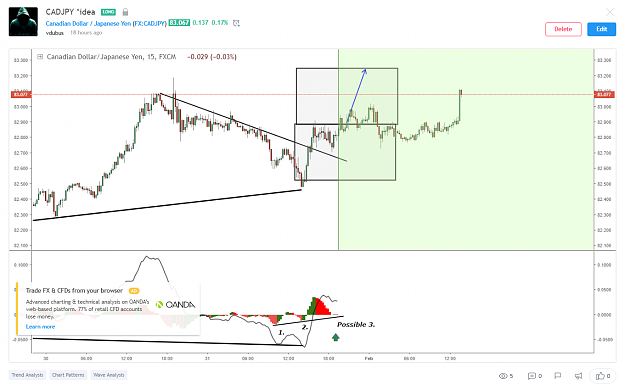
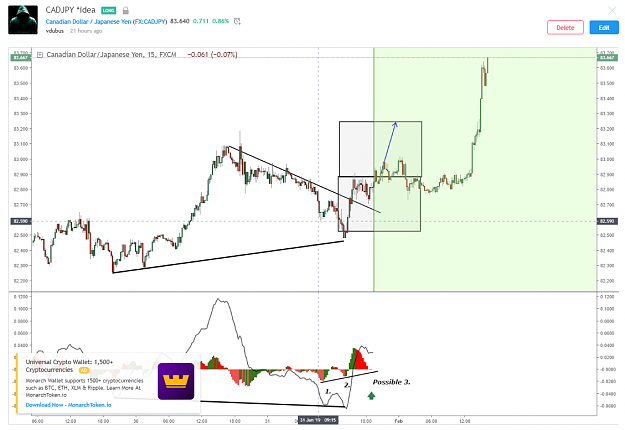
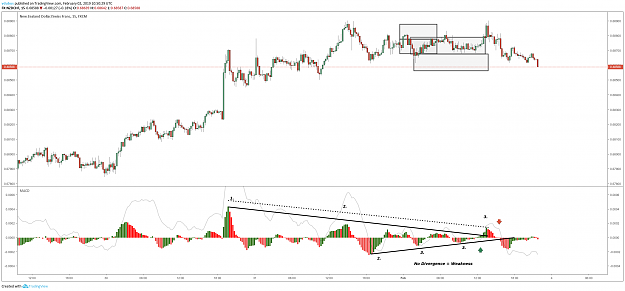
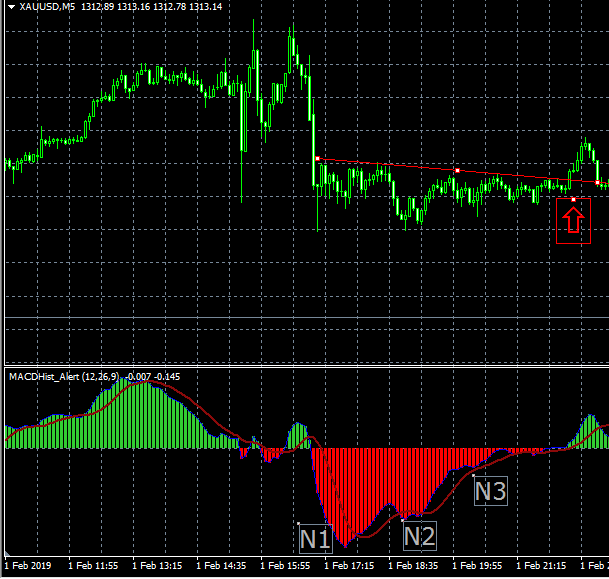
1. to 2. = Divergence
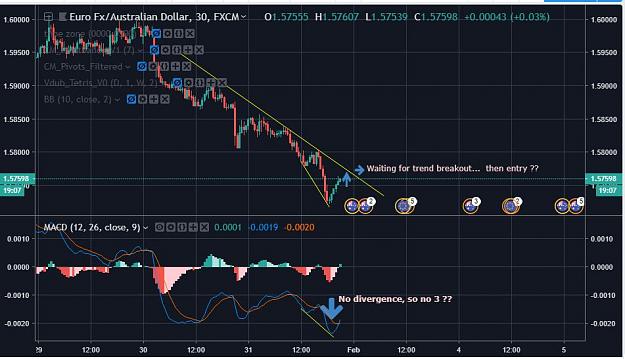
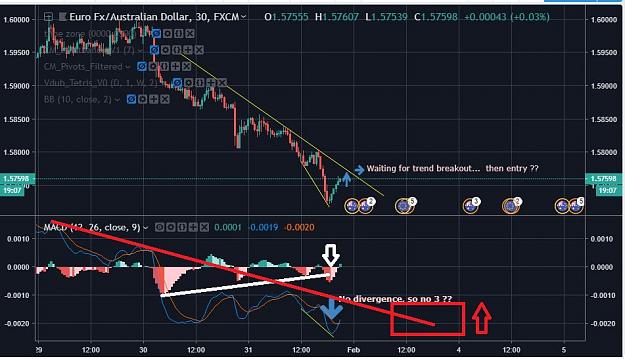
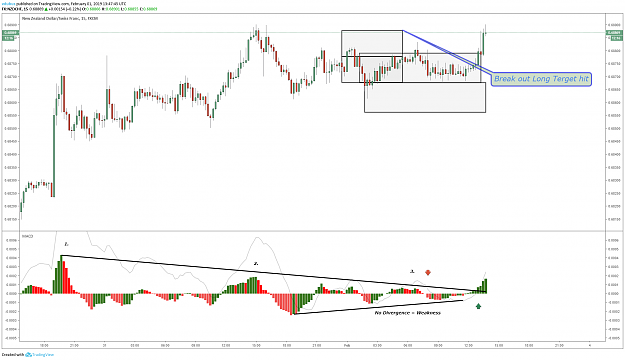
2. to 3 = No Divergence = Weakness = Reversal / Breakout
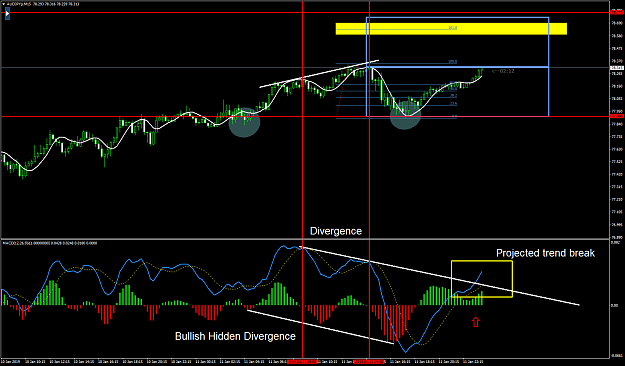
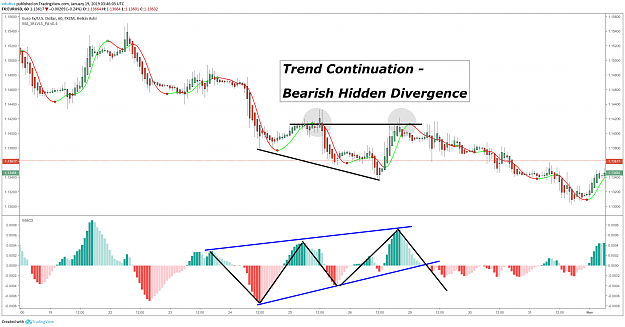
the secret is to identify the Weakness ( No Divergence ) as to it's opposing force would be either regular divergence or Hidden Divergence favouring a trend continuation setup.
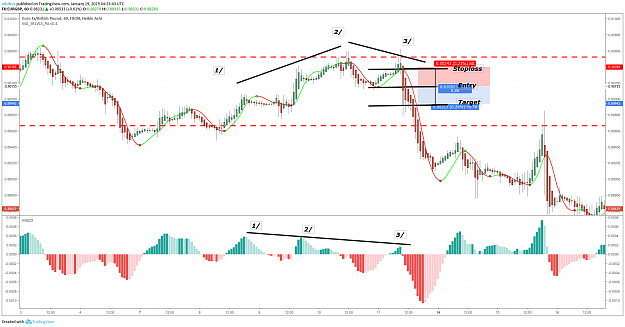
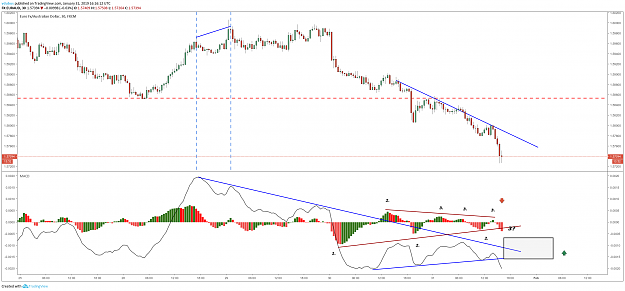
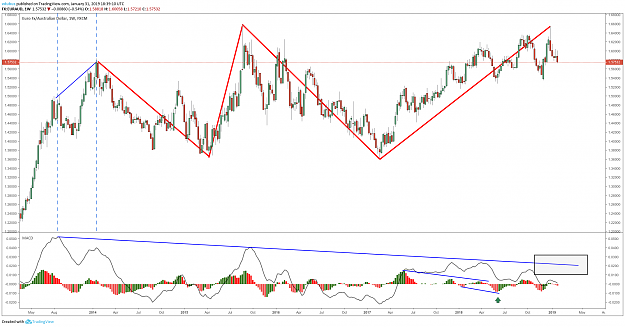
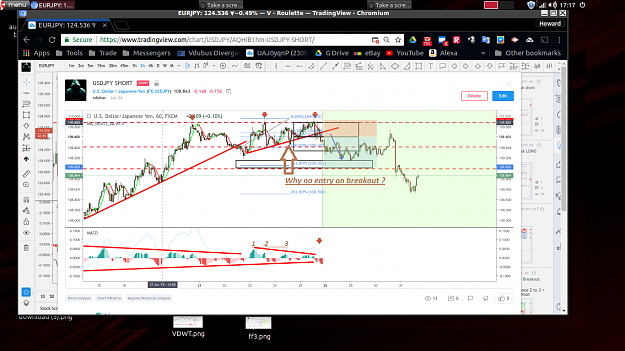
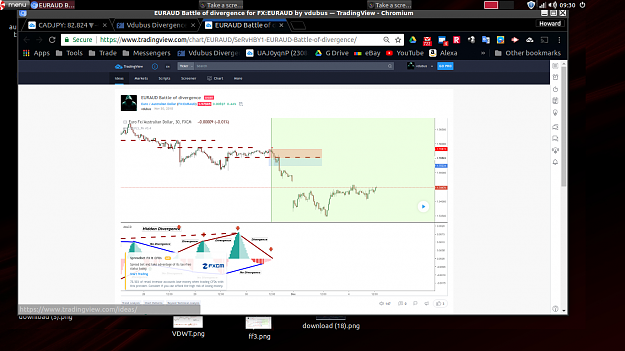
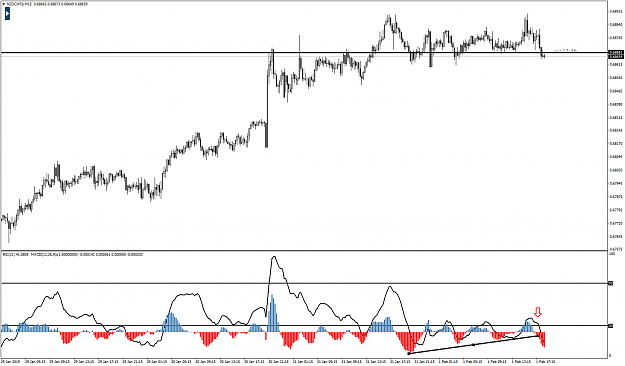
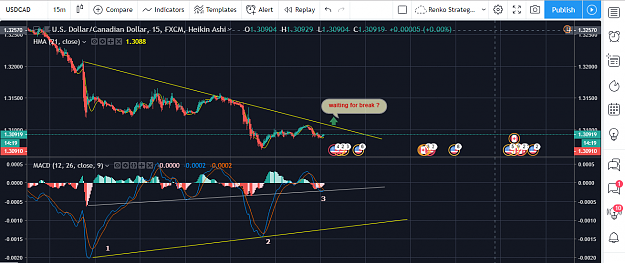
Note the last chart pic. A break of its formation is in it'self a valid signal. ie. The histogram formed a new lower low indicating a Short signal as well as the divergence trend break to the down side.
...Enjoy
===================
Ok So focus primarily on trading divergences, Being that early on in my trading career I identified an algorithm hidden within ' All Oscillators ' going by one simple rule
- Divergence Projects the next trend break & or reversal. ( Please refer to my previous post above )
It wasn't until recently I paid no attention what so ever to the histogram of the MacD. I saw this as unreliable... Until now.
We all are pretty much familiar with divergence & hidden divergence but nothing in true relation to price pattern formations.
The rules are simple:
Follow the money !
1. to 2. = Divergence
2. to 3 = No Divergence = Weakness = Reversal / Breakout
the secret is to identify the Weakness ( No Divergence ) as to it's opposing force would be either regular divergence or Hidden Divergence favouring a trend continuation setup.
Note the last chart pic. A break of its formation is in it'self a valid signal. ie. The histogram formed a new lower low indicating a Short signal as well as the divergence trend break to the down side.
...Enjoy
===================
Attached Image(s) (click to enlarge)