Hello everybody, I would like to introduce all of you a trading strategy I have been working on many months, my main focus is to find someone that will convert this to an EA + Dashboard in order to remove manual intervention or to reduce it to the minimum, basically because of the screen time I have everyday 
Strategy is mainly based on trading the pullbacks of a trend, meaning that we will always be trading in favour of the main momentum.
I try to remove any discretional trading and reduce it to a follow certain rules, I'm really sure if trader common sense is added... Well, this usually improves everything quite a lot...
In order to show this strategy I will try to describe the entry methods and bad entry methods, all the feedback will be always appreciate as well as adding new indicators, but ONLY, and I say ONLY, when this new addition is bringing filter to bad entries in order to increase this strategy reliability... So if you are going to change the strategy 360º just avoid posting in this thread and start your new one
Said this, let's start with the real stuff...
Indicators:
- MBFX Timing
I really like this indicator, like an stochastic, really helpul to spot divergences and OB/OS price in order to start watching this pair, in this strategy will be one of our "Triggers"
- Half-Trend
Honestly I don't know the actual formula or how it calculates, however I found this indicator usually really reflects short term S/R zones, and for our strategy will be an important part when price breaks it.
- BK Woodie
Another Indicator that I like, combination of SMA, different periods CCI, really useful to spot if current momentum is fading.
- Sweet Spots Gold
Just to reflect current Round Numbers, natural S&R zones and even in H4 TF price is reacting to them, this indicator is useful for me, you can skip it if you want...
So let's start with the rules...
We need to identify market conditions, are we in a trend? in range? Imagine we are in an uptrend, we see what I call a "healthy pullback" which means that is going bellow half trend and BK Woodie goes bellow 0 as well, MBFX of course will then follow going near or into OB/OS zone... Our entry then will be when we identify based on indicators that current pullback is over and trend momentum is resuming.
BUY RULES
1st Check
The market condition, we don't really want to go against the trend, or we do?
2nd Check
Price broke and closed above Half trend ( For this to happen price had to go first below hehe )
3rd Check
MBFX is sloping up, an entry on MBFX yellow is more risky but also you catch it earlier, more slope, more momentum, better chances of a good entry
4th Check
BK Woodie went bellow 0 and is now pointing up and crossing or "wanting" to cross it
5th Check
BK Woodie Square is GREEN, meaning price is above a 25 SMA
6th Check
BK Woodie CCI (Both of them) are comming to cross 0 and NEVER, OVER or BELOW 100 / -100, I found best entries is when CCI is very near to cross 0.
SELL RULES
1st Check
The market condition! We want to be sure we go with a downtrend
2nd Check
Price broke and closed below Half trend ( For this to happen price had to go first above hehe )
3rd Check
MBFX is sloping down, an entry on MBFX yellow is more risky but also you catch it earlier, more slope, more momentum, better chances of a good entry
4th Check
BK Woodie went above 0 and is now pointing down and crossing or "wanting" to cross it
5th Check
BK Woodie Square is RED, meaning price is below a 25 SMA
6th Check
BK Woodie CCI (Both of them) are comming to cross 0 and NEVER, OVER or BELOW 100 / -100, I found best entries is when CCI is very near to cross 0.
And now you will want entry examples, right?
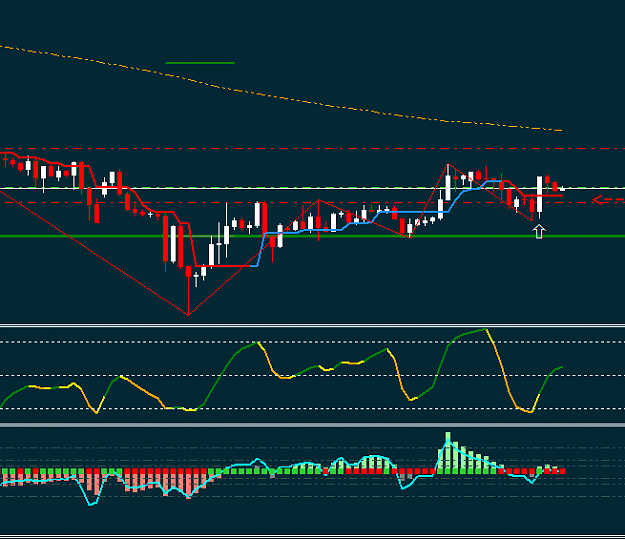
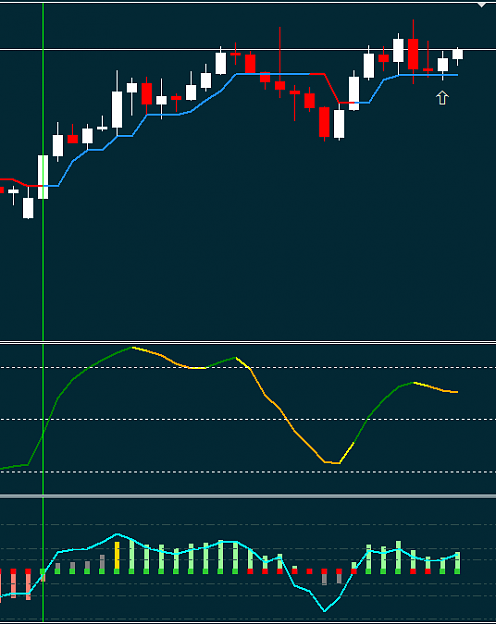
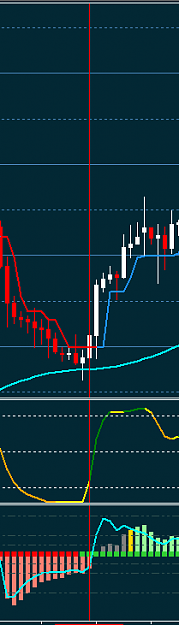
Example for a BUY:
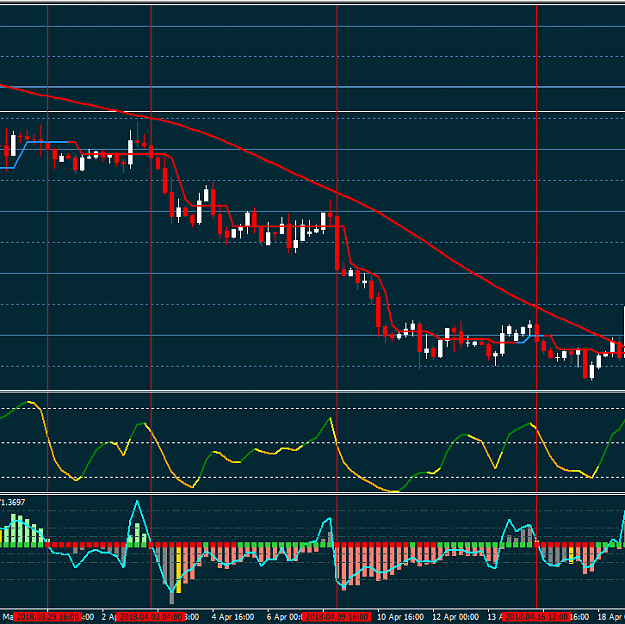
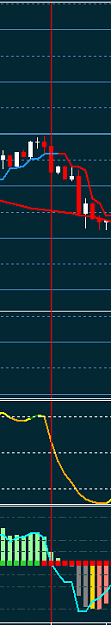
Example for a SELL
You see than in both entries, something happened near a Round Number, once a false breakout and other one a RN Rejection, so I add this to my strategy as well, but is not part of what I'm posting...
I think it's clear? Now let's run a test of entries for some months on EURUSD...
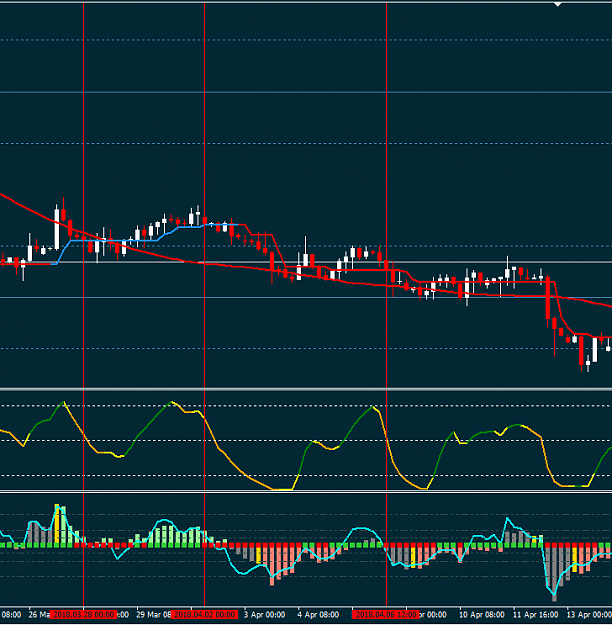
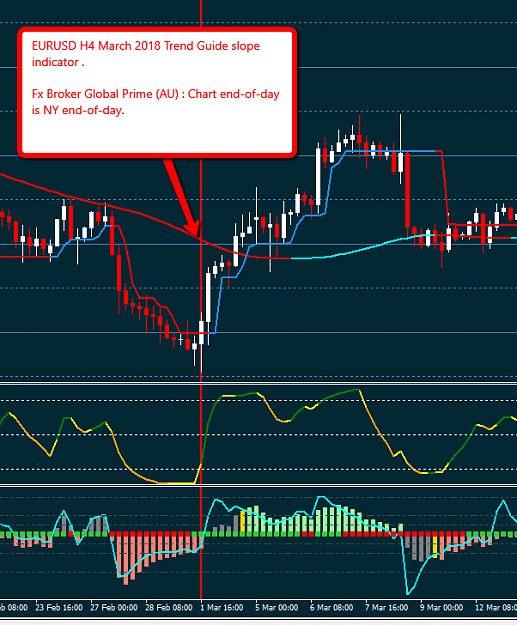
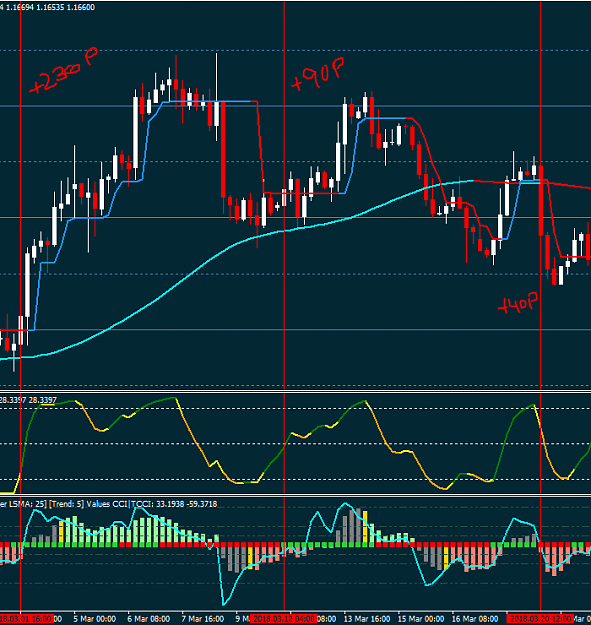
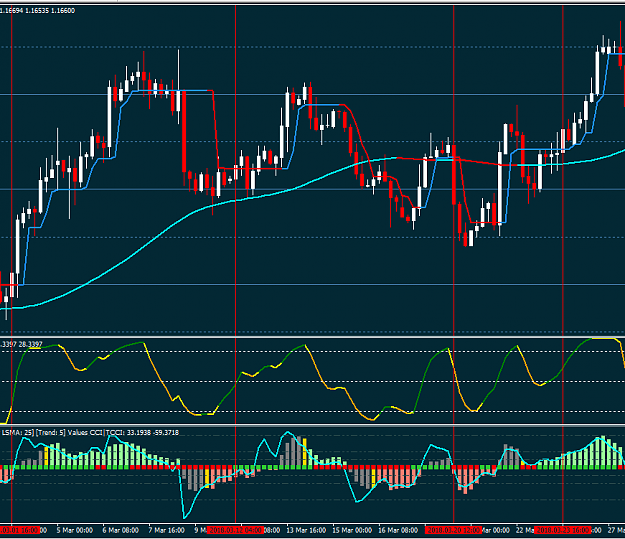
March 2018, 3 Entries, some of them running for days, total of 360 Pips
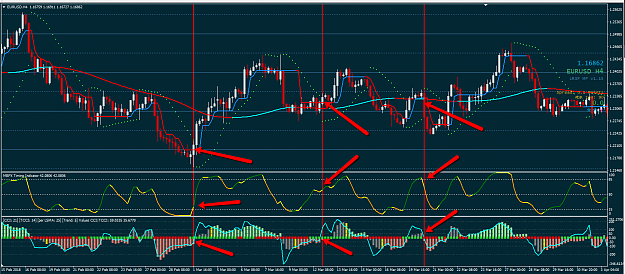
March 2018 Entries avoiding the 4th Check, we have 1 new entry adding up +110 pips to the previous 360pips
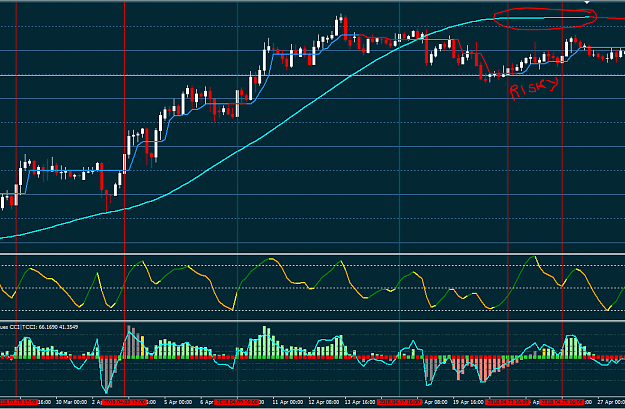
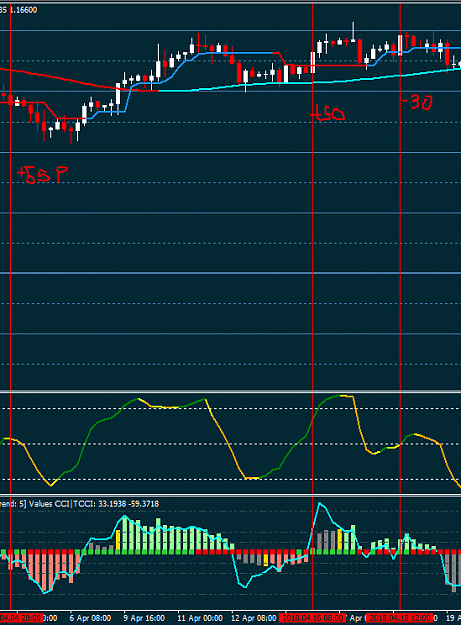
April 2018, 3 Entries, 1 SL Hit (-30P) So a total of +75 Pips
April was a bit crazy, almost no pullbacks since the drop...
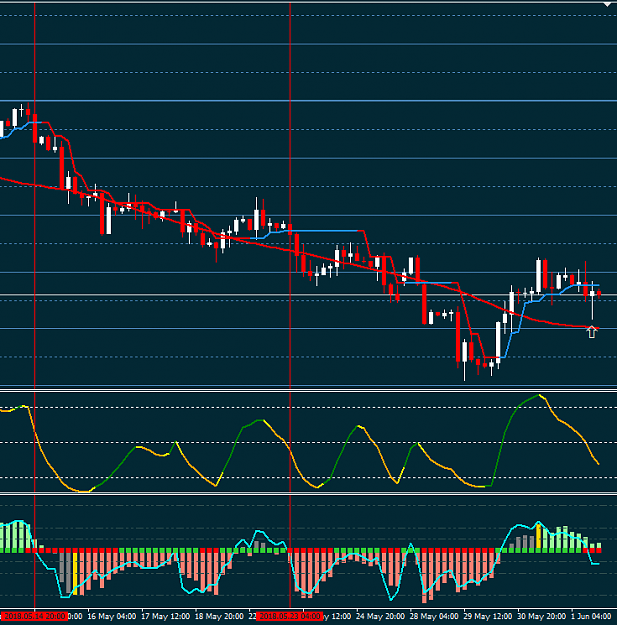
May 2018, beautiful month for this strat... 2 Entries running for almost the whole month... Running at around 600pips both...
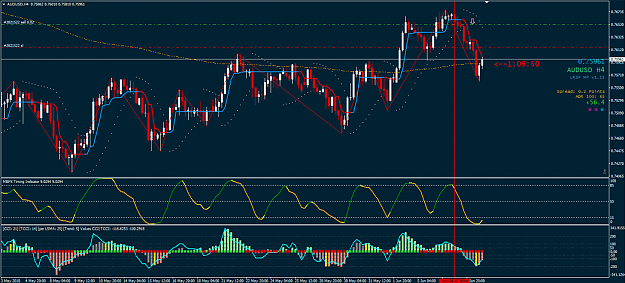
Jun 2018, you can look the chart by yourself we had a traing oportunity day 1, run +40 pips and not it's more or less at entry point...
The initial StopLoss
Agresive SL:
Initial Stoploss should be “Dynamic” and based on Half Trend, we need to define initial Stoploss at Half Trend + X for me and I trust a lot Half Trend and the way it reflects short term resistances, I like to put my SL at Half trend + 5 pips
Conservative SL:
Like always, just spot a reliable key level where you see that price got rejected previously, a lower high or higher low, even zones with wicks at more or less same level... put your SL there, consider that puting a conservative SL will affect our RR Ratio as our risk will be higher in case trade goes nuts
BUUUUUUUT!!! There is always a but...
I don't place my SL physically, I know that I will close the trade if a candle CLOSES on my SL, not if the price touches it, this way I increase the risk of course, but also LOTS of situations whe price is just comming to retest the zone and get rejected to continue...
Look here how the price is rejected at half trend zone and continues the movement... You get the point?
Attachment g
The initial StopLoss at half trend + X pips is really important, and also this StopLoss should ONLY be activated after candle close, as I said Price very often touches the level just to be rejected back again, Trade should be exited only if Price is closing IN or pass our Imaginary SL.
What you could have is a hard SL, just to make sure you don't get burned on a heavy news event and unexpected big move.
Counter Trade:
What is the counter trade? Counter trade is when we are trading against the current trend momentum, and when D1 stochastic for example is pointing UP or trend is clearly UP and we do a SELL Trade, if our SL gets hit we are going to open a counter trade position, I don't martingale it, I just cover my loss, but you are free of course as most of the time you catch the trend resuming and hence good oportunities for some good pips.
Attached Image (click to enlarge)
https://www.forexfactory.com/attachm...1&d=1530119332
- Let's we placed SL at Half Trend + 10 pips, our SL gets triggered when a candle closed over it, we then, as D1 Stoch remains intact we open a counter trade.
- I like counter trades when they are "triggered" 1 or 2 candles maximum after my signal candle (NOT THE ENTRY CANDLE) this usually means a strong reversal point and usually strong trend in the direction where our counter trade is going to be opened.
Indicators and Template:
Strategy is mainly based on trading the pullbacks of a trend, meaning that we will always be trading in favour of the main momentum.
I try to remove any discretional trading and reduce it to a follow certain rules, I'm really sure if trader common sense is added... Well, this usually improves everything quite a lot...
In order to show this strategy I will try to describe the entry methods and bad entry methods, all the feedback will be always appreciate as well as adding new indicators, but ONLY, and I say ONLY, when this new addition is bringing filter to bad entries in order to increase this strategy reliability... So if you are going to change the strategy 360º just avoid posting in this thread and start your new one
Said this, let's start with the real stuff...
Indicators:
- MBFX Timing
I really like this indicator, like an stochastic, really helpul to spot divergences and OB/OS price in order to start watching this pair, in this strategy will be one of our "Triggers"
- Half-Trend
Honestly I don't know the actual formula or how it calculates, however I found this indicator usually really reflects short term S/R zones, and for our strategy will be an important part when price breaks it.
- BK Woodie
Another Indicator that I like, combination of SMA, different periods CCI, really useful to spot if current momentum is fading.
- Sweet Spots Gold
Just to reflect current Round Numbers, natural S&R zones and even in H4 TF price is reacting to them, this indicator is useful for me, you can skip it if you want...
So let's start with the rules...
We need to identify market conditions, are we in a trend? in range? Imagine we are in an uptrend, we see what I call a "healthy pullback" which means that is going bellow half trend and BK Woodie goes bellow 0 as well, MBFX of course will then follow going near or into OB/OS zone... Our entry then will be when we identify based on indicators that current pullback is over and trend momentum is resuming.
BUY RULES
1st Check
The market condition, we don't really want to go against the trend, or we do?
2nd Check
Price broke and closed above Half trend ( For this to happen price had to go first below
3rd Check
MBFX is sloping up, an entry on MBFX yellow is more risky but also you catch it earlier, more slope, more momentum, better chances of a good entry
4th Check
BK Woodie went bellow 0 and is now pointing up and crossing or "wanting" to cross it
5th Check
BK Woodie Square is GREEN, meaning price is above a 25 SMA
6th Check
BK Woodie CCI (Both of them) are comming to cross 0 and NEVER, OVER or BELOW 100 / -100, I found best entries is when CCI is very near to cross 0.
SELL RULES
1st Check
The market condition! We want to be sure we go with a downtrend
2nd Check
Price broke and closed below Half trend ( For this to happen price had to go first above
3rd Check
MBFX is sloping down, an entry on MBFX yellow is more risky but also you catch it earlier, more slope, more momentum, better chances of a good entry
4th Check
BK Woodie went above 0 and is now pointing down and crossing or "wanting" to cross it
5th Check
BK Woodie Square is RED, meaning price is below a 25 SMA
6th Check
BK Woodie CCI (Both of them) are comming to cross 0 and NEVER, OVER or BELOW 100 / -100, I found best entries is when CCI is very near to cross 0.
And now you will want entry examples, right?
Example for a BUY:
Attached Image (click to enlarge)
Example for a SELL
Attached Image (click to enlarge)
You see than in both entries, something happened near a Round Number, once a false breakout and other one a RN Rejection, so I add this to my strategy as well, but is not part of what I'm posting...
I think it's clear? Now let's run a test of entries for some months on EURUSD...
March 2018, 3 Entries, some of them running for days, total of 360 Pips
Attached Image (click to enlarge)
March 2018 Entries avoiding the 4th Check, we have 1 new entry adding up +110 pips to the previous 360pips
Attached Image (click to enlarge)
April 2018, 3 Entries, 1 SL Hit (-30P) So a total of +75 Pips
April was a bit crazy, almost no pullbacks since the drop...
Attached Image (click to enlarge)
May 2018, beautiful month for this strat... 2 Entries running for almost the whole month... Running at around 600pips both...
Attached Image (click to enlarge)
Jun 2018, you can look the chart by yourself we had a traing oportunity day 1, run +40 pips and not it's more or less at entry point...
The initial StopLoss
Agresive SL:
Initial Stoploss should be “Dynamic” and based on Half Trend, we need to define initial Stoploss at Half Trend + X for me and I trust a lot Half Trend and the way it reflects short term resistances, I like to put my SL at Half trend + 5 pips
Conservative SL:
Like always, just spot a reliable key level where you see that price got rejected previously, a lower high or higher low, even zones with wicks at more or less same level... put your SL there, consider that puting a conservative SL will affect our RR Ratio as our risk will be higher in case trade goes nuts
BUUUUUUUT!!! There is always a but...
I don't place my SL physically, I know that I will close the trade if a candle CLOSES on my SL, not if the price touches it, this way I increase the risk of course, but also LOTS of situations whe price is just comming to retest the zone and get rejected to continue...
Look here how the price is rejected at half trend zone and continues the movement... You get the point?
Attachment g
The initial StopLoss at half trend + X pips is really important, and also this StopLoss should ONLY be activated after candle close, as I said Price very often touches the level just to be rejected back again, Trade should be exited only if Price is closing IN or pass our Imaginary SL.
What you could have is a hard SL, just to make sure you don't get burned on a heavy news event and unexpected big move.
Counter Trade:
What is the counter trade? Counter trade is when we are trading against the current trend momentum, and when D1 stochastic for example is pointing UP or trend is clearly UP and we do a SELL Trade, if our SL gets hit we are going to open a counter trade position, I don't martingale it, I just cover my loss, but you are free of course as most of the time you catch the trend resuming and hence good oportunities for some good pips.
Attached Image (click to enlarge)
https://www.forexfactory.com/attachm...1&d=1530119332
- Let's we placed SL at Half Trend + 10 pips, our SL gets triggered when a candle closed over it, we then, as D1 Stoch remains intact we open a counter trade.
- I like counter trades when they are "triggered" 1 or 2 candles maximum after my signal candle (NOT THE ENTRY CANDLE) this usually means a strong reversal point and usually strong trend in the direction where our counter trade is going to be opened.
Indicators and Template:
Attached File(s)
Building a Freedom All Time Return:
5,178.8%