Welcome to our blog: Equilibrium, is a key to success
Hello dear trader,
70% of the courses take place in the Equilibrium, hence the title: Equilibrium, the key to success. I warmly welcome you to our block and I am pleased that you are interested in this information.
I started my apprenticeship in financial services for banking, equity and investment fund 30 years ago. After the FX charts, I had my first experience with the MT4 on Windows XP in 2006, which was still subject to a fee. From 2010 I concentrated almost exclusively on the Forex market and after the ESMA regulation I registered as a professional trader. I’m among the 4% of professional Forex traders in Europe, who can trade up to 400 with a lever and at the same time I have extremely good protection in the event of an uncontrolled breakout. I initially worked exclusively with Forex data (supply and demand) for many years by trading the short movements within an equilibrium. The the tick charts are the reason, that I looked more closely at the stock market data and found, that this data has a similar structure. In the past year, this resulted in some projects. I compared different providers of stock market data, got closer to the high-frequency trading / big players and looked for suitable software that was able to translate the stock market data according to my specifications. Today I trade almost exclusively with the information of the stock exchange data in the forex market.
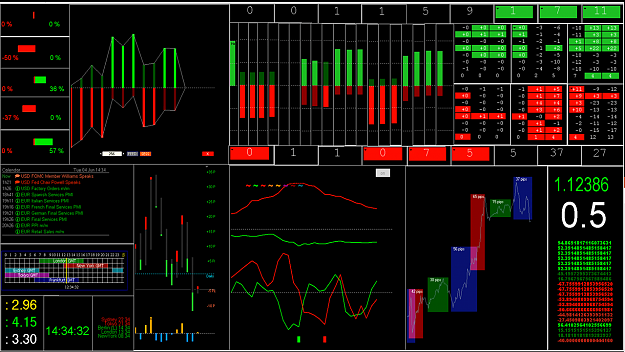
You will find many good auxiliary indicators for the MT4 here, some of which I developed and programmed myself. You will also receive specific information about the footprint chart, volume chart, market profile, the DOM and the times and sales list. If you want to be successful in this market in the long term, you have to take a closer look at how the big players work. A price does not change because a moving average has crossed, an RSI is overbought or a fibozone has been reached, but because market orders meet the limit orders. The big players determine the market and they pursue a goal. This goal can only be recognized if you know what they are up to.
I have been concentrating on stock market data for two years, so the volume with bid and ask and especially liquidity has become the focus of my attention. The pure candles or price information give us traders an incorrect picture of the market, because a strong bullish candle does not necessarily mean that someone is buying the euro to push the price further up. Once a big player sells their dollars after a downtrend, a strong bullish candle may also emerge. However, this cannot be seen from the pure candle representation in Forex.
Many years ago I thought that with the pure candle chart I would be able to determine trends and resistance zones. Through the exact analysis of the futures data with my prop software, I came to the conclusion that there are actually no trends and no real resistance zones. The resistance zones that we see are initiated by the big players to deceive us and alleged trends are there to mislead dump money.
However, this was a development over 2 years, which you can read about in this blog. Two years ago I started a kind of trader's diary in this forum, with the requirement to document my further development exactly. In this blog you will not find a specific system, but many creative ideas with which you can create an individual setup for yourself. Among other things, I describe exactly what the forex data have in common with the futures data. A key point is the way big players work. They alone determine the market and you will see why they will always find your stops.
This blog is structured like a book in chronological order and deals with the subject of supply and demand, trading in equilibrium and data in the futures market. I am convinced that you can use some ideas, but I recommend that you work through this blog from the beginning. While this takes around 20 hours, a crucial idea you find can potentially change everything
Within these topics, 10 projects have been created so far
1. Trend of supply and demand
2. Bioniccandle-The effective new candle
3. Dashboard - The help in daily trading
4. High frequency trader in action
5. Tickchart- The Lot, the only reason of price movement
We are currently working on our tenth and most complex project. It is about combining the advantages of the futures market with the advantages of the interbank market.
Respect, decency and mutual fairness are the basis of this blog. This is exactly what we can all be proud of and I am sure that with these virtues we can achieve the success we all want. The markets change daily and those who stop developing in this profession are quickly overwhelmed by the market. Further development together with like-minded people is my only intention in this blog.
I look forward to a great collaboration.
best regards
Michael
The Equilibrium, a key to success!
Supply, demand and market balance form the basis of microeconomics. Take only 20 minutes and watch two videos.
This example with apples shows our market situation. It's always about finding the best price, and the best price is always in balance. Here in the Forex market, there is a crucial difference to the example shown in the video.
Every trader can sometimes act as a seller and sometimes as a buyer. And that is a very special opportunity. But I have to understand the connection between supply and demand. If I can determine the equilibrium on the basis of the Kurtselle, I turned the future probability in my favor.
For some years now, I've stopped by at Forex Factory and was always excited about the great contributions. Interesting opinions, charts and indicators should help to support the private trader. In this shark tank the forex market is turbulent. The beginners have a hard time. Just think about football once. If you want to learn football, you can start in a youth team and play up to the NFL.
In the Forex market, there is no beginner market, because the beginner plays against the biggest professionals in the world. And how that ends, everyone can think.
Well, if there are such platforms as Forex Factory, where traders from all over the world come together to face the biggest traders in the world. Of course, every trader is the competitor to the other, but you help each other out.
When trading, there are many keys to success. In my first post I want to show you a key to success. I do not want to discuss with you the meaning or nonsense of this key, but about the implementation to success. If the post is of any use to you, use the information, otherwise forget it again.
I do not claim that this key is the master key that always works.
This key works without indicators for all traders (of course only those who want to) in all time units.
The key "Equilibrium"
1. The price is determined by supply and demand in each market.
2. Any influence on the price will be returned from the price
3. Before the price moves up or down, a balance between supply and demand creates a balance.
4. If this balance is disturbed, the price moves in the direction of supply or in the direction of demand.
5. The price moves as long as supply or demand until there is a balance again. Then the whole thing starts from the beginning.
Most candles are where there is a balance. We do not want to trade there, because the price is not moving very much. So we have to act when there is no balance.
There are 3 different states in the market.
1. Offer outweighs the demand = price drops
2. Demand outweighs the offer = price rises
3. Supply and demand are balanced
According to the sellers the offer (short) there, while the buyers represent the demand (long).
1. Offer = Seller (short)
2. Request = Buyer (long)
The quantity available on the market represents the supply, the demand is the quantity that the buyer would like to purchase.
If you shop at the weekly market, do you want to pay $ 6 or 4 $ for 4 lbs tomatoes? Of course, only $ 4. So, assuming the product has the same quality, you will buy from the dealer, who only charges $ 4 for the tomatoes. Thus, the demand will be greater at the cheaper dealer than at the expensive dealer.
So what does the trader who sells the tomatoes for $ 6 / lbs do? For now, he only needs to sell 66% as much as his competitor to earn the same. Or he waits until the competitor has no more tomatoes, then sells his tomatoes for $ 6 / lb and earns 50% more. In the worst case, he has to go down with the price. These competing factors (supply and demand) meet each other in all markets and regulate the price.
In the stock market environment, the price strives to find a so-called equilibrium. At that moment, buyers and sellers are equally satisfied until an imbalance rebalances in favor of supply or demand. Then the prices rise or fall again.
But even if you can accurately identify supply and demand, you will not get on with it. Decisive are the zones where the supply outweighs the demand or the demand the supply.
Known as resistance or support.
These reversal points, which often have an increased volume, must be recognized.
There are many ways to work with resistance and support lines, I myself work only with horizontal lines, because I have the best experience.
Option A: Confirmation of resistance or support
If you have drawn resistance and support lines in the chart, look how the price is there. A later entry will often save you from big losses, but you will get into a less favorable course and minimize your potential profit. Important: the highest possible risk-reward ratio.
Option B: Enter without confirmation
You are sure how the course will behave at your indicated resistance or support line and will board immediately without waiting for a confirmation. If your expectation works out, you are at a bargain price, improving the chance-risk ratio. If the trade unfolds to your disadvantage, you need to get out early to protect yourself from major losses.
Identification of the equilibrium
The big problem with the candles in the chart is the period in which they are formed. Surely you know the candlestick formations like hammer, doji, engulfing, etc. Sometimes you work, but often not. This is due to the temporal composition of the candles. Candle formations in a certain time frame are therefore just a mere random product of the time, the broker and the dealer. If you change the time frame in which the candles are formed, so would the candles and their formations change. The doji is now a normal candle with no indication of a course change.
Therefore one should work with different time units to identify a possible equilibrium. Many turning points can be identified by means of the Equilibrium, but not all. The price in the chart is always random and nobody can predict 100% of the turning points in the chart. It's not necessary with strategic money management either. Decisive is the payoff ratio and the expectancy.
You can often see these turning points in advance and use them to your advantage. You have to look at the past of the charts, because the big traders (elephants) leave their mark in the snow, which is easier to recognize than the tracks of the small traders (hares).
Another advantage is that you do not have to load your screen with unnecessary indicators. Although I work with a self-created dashboard, which tells me primarily the momentary strength of each currency pairs and, for example, the dollar index, but I'm interested in this just before the entry or exit.
My main charts are almost entirely made up of my own resistance and support lines. The Candle Strength indicator often helps me to identify the effective candle thickness, which is not always easy with the above points.
The best indicator is the price chart and the orderbook. But the price chart is a trailing indicator, because only when the candle is completed, I get a meaningful information on the price level. But then it is often too late.
In my preliminary analysis, start with the day or 4H chart to determine the rough direction.
The 1H chart shows me the medium term bias and the 15min / 5 min chart the short term turning points in the market.
A very important instrument for me is the 15 second bar chart. In high phases of volatility you can recognize a structure faster.
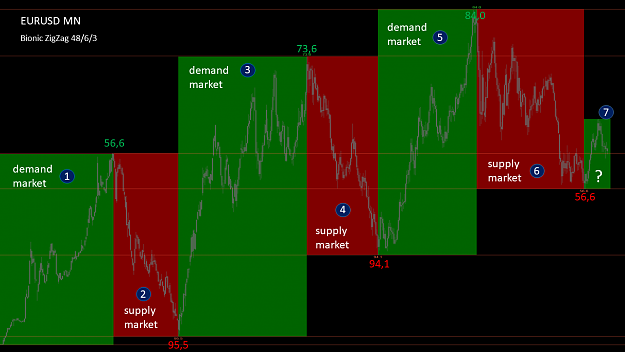
A catchy example of equilibrium was in the EURUSD. After the price had risen from 1.03249 on 26.12.16 with a triple top to 1.20921 on 08.09.17 and slowly went into the correction phase, many traders wondered how far this correction would go.
The interesting thing is that the price of 1.15529 in the monthly chart was already reflected in a 2003 Equilibrium.
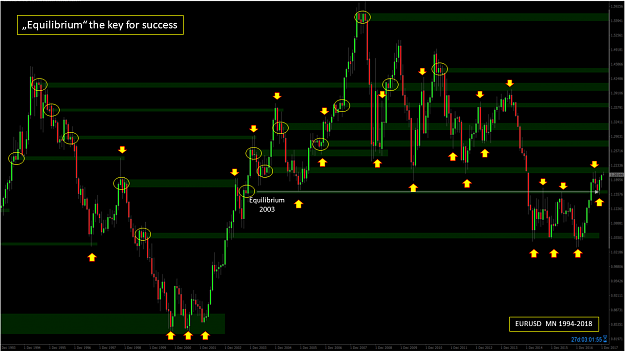
If you look at the monthly chart from 1994 to 2018, you could derive some trading possibilities from the Equilibrium. This usually works in every unit of time.
Example Equilibrium in the 15 min chart between 11th and 13th October 2017
Now you will wonder if that always works. The answer is NO!
Then all traders would be millionaires. If someone wins $ 100, another will lose $ 100. That's the system.
If you have lost $ 100 you should not be sad. The money is not gone, it has only one other. And he's sure to be happy.
The identification of the relevant equilibrium is difficult and only possible through many years of experience. But as you can see, this trading option is well worth it. It is interesting for swing traders, day traders and scalpers and can be used in all timeframes.
To better identify an equilibrium, one should zoom down from higher time units to smaller time units. This filters out inaccuracies.
Incidentally, it is often helpful in the chart to remove the shadows to better recognize the Equilibrium.
Equilibrium in the 15 min chart with and without shadow
With Buy Limit and Sell Limit Order you can work well in this trading system, but is rather less recommended when scalping.
Even an Equlibrium professional will reach its limits, because trading has changed enormously in recent years. The price is unpredictable and still random. Even if you work with an orderbook, you often have to realize that there are many pseudo orders that are deleted shortly before the target. Oderflow, Footprint and Cumulative Delta are still good help, but unfortunately they can not look to the future.
Trading and making music have something in common. You can learn to play both, but in the end it's the right feeling and flair that determines success and failure.
I wish you a lot of flair and feeling for the great success.
Attached Image
Hello dear trader,
70% of the courses take place in the Equilibrium, hence the title: Equilibrium, the key to success. I warmly welcome you to our block and I am pleased that you are interested in this information.
I started my apprenticeship in financial services for banking, equity and investment fund 30 years ago. After the FX charts, I had my first experience with the MT4 on Windows XP in 2006, which was still subject to a fee. From 2010 I concentrated almost exclusively on the Forex market and after the ESMA regulation I registered as a professional trader. I’m among the 4% of professional Forex traders in Europe, who can trade up to 400 with a lever and at the same time I have extremely good protection in the event of an uncontrolled breakout. I initially worked exclusively with Forex data (supply and demand) for many years by trading the short movements within an equilibrium. The the tick charts are the reason, that I looked more closely at the stock market data and found, that this data has a similar structure. In the past year, this resulted in some projects. I compared different providers of stock market data, got closer to the high-frequency trading / big players and looked for suitable software that was able to translate the stock market data according to my specifications. Today I trade almost exclusively with the information of the stock exchange data in the forex market.
You will find many good auxiliary indicators for the MT4 here, some of which I developed and programmed myself. You will also receive specific information about the footprint chart, volume chart, market profile, the DOM and the times and sales list. If you want to be successful in this market in the long term, you have to take a closer look at how the big players work. A price does not change because a moving average has crossed, an RSI is overbought or a fibozone has been reached, but because market orders meet the limit orders. The big players determine the market and they pursue a goal. This goal can only be recognized if you know what they are up to.
I have been concentrating on stock market data for two years, so the volume with bid and ask and especially liquidity has become the focus of my attention. The pure candles or price information give us traders an incorrect picture of the market, because a strong bullish candle does not necessarily mean that someone is buying the euro to push the price further up. Once a big player sells their dollars after a downtrend, a strong bullish candle may also emerge. However, this cannot be seen from the pure candle representation in Forex.
Many years ago I thought that with the pure candle chart I would be able to determine trends and resistance zones. Through the exact analysis of the futures data with my prop software, I came to the conclusion that there are actually no trends and no real resistance zones. The resistance zones that we see are initiated by the big players to deceive us and alleged trends are there to mislead dump money.
However, this was a development over 2 years, which you can read about in this blog. Two years ago I started a kind of trader's diary in this forum, with the requirement to document my further development exactly. In this blog you will not find a specific system, but many creative ideas with which you can create an individual setup for yourself. Among other things, I describe exactly what the forex data have in common with the futures data. A key point is the way big players work. They alone determine the market and you will see why they will always find your stops.
This blog is structured like a book in chronological order and deals with the subject of supply and demand, trading in equilibrium and data in the futures market. I am convinced that you can use some ideas, but I recommend that you work through this blog from the beginning. While this takes around 20 hours, a crucial idea you find can potentially change everything
Within these topics, 10 projects have been created so far
Attached Image (click to enlarge)
1. Trend of supply and demand
Attached Image (click to enlarge)
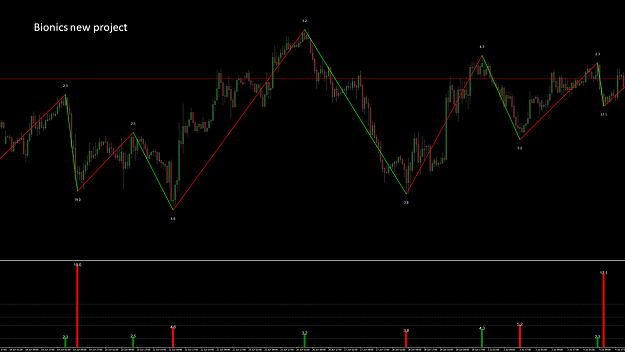
2. Bioniccandle-The effective new candle
Attached Image (click to enlarge)
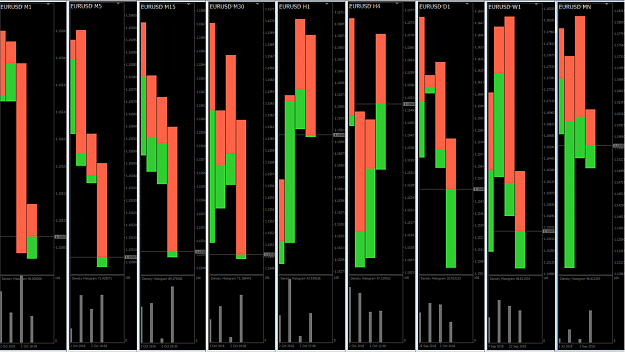
3. Dashboard - The help in daily trading
Attached Image (click to enlarge)
4. High frequency trader in action
Attached Image
5. Tickchart- The Lot, the only reason of price movement
Inserted Video
We are currently working on our tenth and most complex project. It is about combining the advantages of the futures market with the advantages of the interbank market.
Respect, decency and mutual fairness are the basis of this blog. This is exactly what we can all be proud of and I am sure that with these virtues we can achieve the success we all want. The markets change daily and those who stop developing in this profession are quickly overwhelmed by the market. Further development together with like-minded people is my only intention in this blog.
I look forward to a great collaboration.
best regards
Michael
The Equilibrium, a key to success!
Supply, demand and market balance form the basis of microeconomics. Take only 20 minutes and watch two videos.
Inserted Video
This example with apples shows our market situation. It's always about finding the best price, and the best price is always in balance. Here in the Forex market, there is a crucial difference to the example shown in the video.
Inserted Video
Every trader can sometimes act as a seller and sometimes as a buyer. And that is a very special opportunity. But I have to understand the connection between supply and demand. If I can determine the equilibrium on the basis of the Kurtselle, I turned the future probability in my favor.
For some years now, I've stopped by at Forex Factory and was always excited about the great contributions. Interesting opinions, charts and indicators should help to support the private trader. In this shark tank the forex market is turbulent. The beginners have a hard time. Just think about football once. If you want to learn football, you can start in a youth team and play up to the NFL.
In the Forex market, there is no beginner market, because the beginner plays against the biggest professionals in the world. And how that ends, everyone can think.
Well, if there are such platforms as Forex Factory, where traders from all over the world come together to face the biggest traders in the world. Of course, every trader is the competitor to the other, but you help each other out.
When trading, there are many keys to success. In my first post I want to show you a key to success. I do not want to discuss with you the meaning or nonsense of this key, but about the implementation to success. If the post is of any use to you, use the information, otherwise forget it again.
I do not claim that this key is the master key that always works.
This key works without indicators for all traders (of course only those who want to) in all time units.
The key "Equilibrium"
1. The price is determined by supply and demand in each market.
2. Any influence on the price will be returned from the price
3. Before the price moves up or down, a balance between supply and demand creates a balance.
4. If this balance is disturbed, the price moves in the direction of supply or in the direction of demand.
5. The price moves as long as supply or demand until there is a balance again. Then the whole thing starts from the beginning.
Most candles are where there is a balance. We do not want to trade there, because the price is not moving very much. So we have to act when there is no balance.
There are 3 different states in the market.
1. Offer outweighs the demand = price drops
2. Demand outweighs the offer = price rises
3. Supply and demand are balanced
According to the sellers the offer (short) there, while the buyers represent the demand (long).
1. Offer = Seller (short)
2. Request = Buyer (long)
The quantity available on the market represents the supply, the demand is the quantity that the buyer would like to purchase.
If you shop at the weekly market, do you want to pay $ 6 or 4 $ for 4 lbs tomatoes? Of course, only $ 4. So, assuming the product has the same quality, you will buy from the dealer, who only charges $ 4 for the tomatoes. Thus, the demand will be greater at the cheaper dealer than at the expensive dealer.
So what does the trader who sells the tomatoes for $ 6 / lbs do? For now, he only needs to sell 66% as much as his competitor to earn the same. Or he waits until the competitor has no more tomatoes, then sells his tomatoes for $ 6 / lb and earns 50% more. In the worst case, he has to go down with the price. These competing factors (supply and demand) meet each other in all markets and regulate the price.
In the stock market environment, the price strives to find a so-called equilibrium. At that moment, buyers and sellers are equally satisfied until an imbalance rebalances in favor of supply or demand. Then the prices rise or fall again.
But even if you can accurately identify supply and demand, you will not get on with it. Decisive are the zones where the supply outweighs the demand or the demand the supply.
Known as resistance or support.
These reversal points, which often have an increased volume, must be recognized.
There are many ways to work with resistance and support lines, I myself work only with horizontal lines, because I have the best experience.
Option A: Confirmation of resistance or support
If you have drawn resistance and support lines in the chart, look how the price is there. A later entry will often save you from big losses, but you will get into a less favorable course and minimize your potential profit. Important: the highest possible risk-reward ratio.
Option B: Enter without confirmation
You are sure how the course will behave at your indicated resistance or support line and will board immediately without waiting for a confirmation. If your expectation works out, you are at a bargain price, improving the chance-risk ratio. If the trade unfolds to your disadvantage, you need to get out early to protect yourself from major losses.
Identification of the equilibrium
The big problem with the candles in the chart is the period in which they are formed. Surely you know the candlestick formations like hammer, doji, engulfing, etc. Sometimes you work, but often not. This is due to the temporal composition of the candles. Candle formations in a certain time frame are therefore just a mere random product of the time, the broker and the dealer. If you change the time frame in which the candles are formed, so would the candles and their formations change. The doji is now a normal candle with no indication of a course change.
Therefore one should work with different time units to identify a possible equilibrium. Many turning points can be identified by means of the Equilibrium, but not all. The price in the chart is always random and nobody can predict 100% of the turning points in the chart. It's not necessary with strategic money management either. Decisive is the payoff ratio and the expectancy.
You can often see these turning points in advance and use them to your advantage. You have to look at the past of the charts, because the big traders (elephants) leave their mark in the snow, which is easier to recognize than the tracks of the small traders (hares).
Another advantage is that you do not have to load your screen with unnecessary indicators. Although I work with a self-created dashboard, which tells me primarily the momentary strength of each currency pairs and, for example, the dollar index, but I'm interested in this just before the entry or exit.
My main charts are almost entirely made up of my own resistance and support lines. The Candle Strength indicator often helps me to identify the effective candle thickness, which is not always easy with the above points.
The best indicator is the price chart and the orderbook. But the price chart is a trailing indicator, because only when the candle is completed, I get a meaningful information on the price level. But then it is often too late.
In my preliminary analysis, start with the day or 4H chart to determine the rough direction.
The 1H chart shows me the medium term bias and the 15min / 5 min chart the short term turning points in the market.
A very important instrument for me is the 15 second bar chart. In high phases of volatility you can recognize a structure faster.
A catchy example of equilibrium was in the EURUSD. After the price had risen from 1.03249 on 26.12.16 with a triple top to 1.20921 on 08.09.17 and slowly went into the correction phase, many traders wondered how far this correction would go.
The interesting thing is that the price of 1.15529 in the monthly chart was already reflected in a 2003 Equilibrium.
Attached Image (click to enlarge)
If you look at the monthly chart from 1994 to 2018, you could derive some trading possibilities from the Equilibrium. This usually works in every unit of time.
Attached Image (click to enlarge)
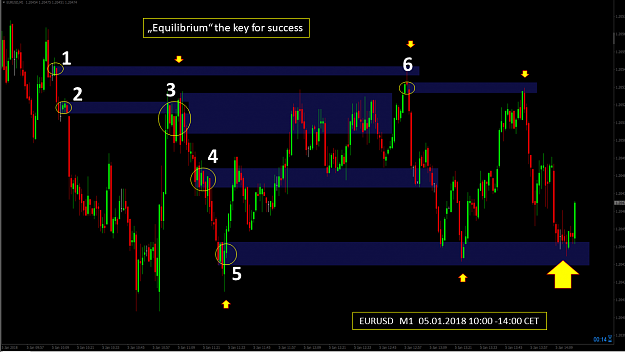
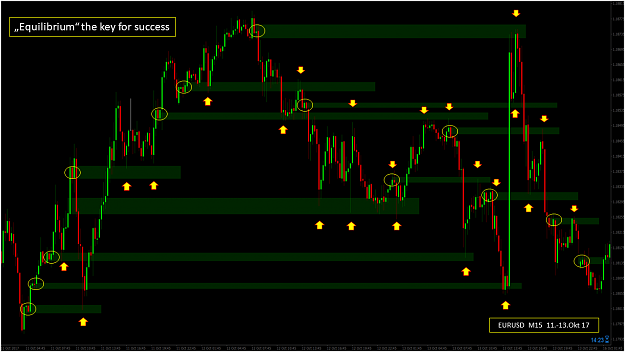
Example Equilibrium in the 15 min chart between 11th and 13th October 2017
Now you will wonder if that always works. The answer is NO!
Then all traders would be millionaires. If someone wins $ 100, another will lose $ 100. That's the system.
If you have lost $ 100 you should not be sad. The money is not gone, it has only one other. And he's sure to be happy.
The identification of the relevant equilibrium is difficult and only possible through many years of experience. But as you can see, this trading option is well worth it. It is interesting for swing traders, day traders and scalpers and can be used in all timeframes.
To better identify an equilibrium, one should zoom down from higher time units to smaller time units. This filters out inaccuracies.
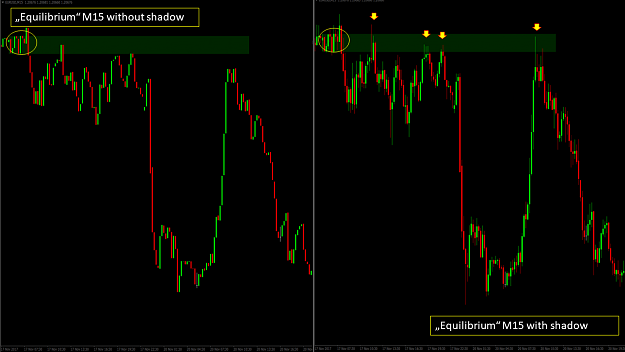
Incidentally, it is often helpful in the chart to remove the shadows to better recognize the Equilibrium.
Attached Image (click to enlarge)
Equilibrium in the 15 min chart with and without shadow
With Buy Limit and Sell Limit Order you can work well in this trading system, but is rather less recommended when scalping.
Even an Equlibrium professional will reach its limits, because trading has changed enormously in recent years. The price is unpredictable and still random. Even if you work with an orderbook, you often have to realize that there are many pseudo orders that are deleted shortly before the target. Oderflow, Footprint and Cumulative Delta are still good help, but unfortunately they can not look to the future.
Trading and making music have something in common. You can learn to play both, but in the end it's the right feeling and flair that determines success and failure.
I wish you a lot of flair and feeling for the great success.
Forget:That does not work, amateurs build the ark, pros the Titanic!