• Home
  • Forums
  • Trades
  • News
  • Calendar
  • Market
  • Brokers
  • Login
  • Join
  • User/Email: Password:
  • 9:55pm
  • Search
Menu
  • Forums
  • Trades
  • News
  • Calendar
  • Market
  • Brokers
  • Login
  • Join
  • 9:55pm
Search
Sister Sites
  • Metals Mine
  • Energy EXCH
  • Crypto Craft

Options

Search
Search
Search

Bookmark Thread

First Page First Unread Last Page Last Post

Printable Version

Similar Threads

Price Will Tell - Supply/Demand Price Action Trading 1846 replies

Difference between buy/sell stops & buy/sell limits 33 replies

how to change buy to sell, sell to buy for EA 1 reply

the buy/buy or sell/sell currency broker?? 5 replies

I am looking for EA to put Buy Stops, Buy limits, Sell limits, and Sell Stops. I will 0 replies

  • Commercial Content
  • /
  • Reply to Thread
  • Subscribe
  • 18
Attachments: Sell Supply Buy Demand Price Action Trading
Exit Attachments

Sell Supply Buy Demand Price Action Trading

  • Last Post
  •  
  • Page 1 2
  • Page 1 2
  •  
  • Post #1
  • Quote
  • First Post: May 29, 2017 12:28am May 29, 2017 12:28am
  •  flylife
  • | Commercial Member | Joined Jan 2014 | 56 Posts
Hello traders. My name is Stefan. I am originally from Romania but I have been living in New Zealand for the last 14 years.

I have been trading the foreign exchange market for the last eleven years. Over the last two years my trading has been consistent and profitable using the same strategy over and over again. I have no secrets, I simply focus now on the factors that actually drives the market and have become fully proficient in them: price, supply/demand, resistance/support, and the trend my friend. I also prefer to use Heikin-Ashi instead of Japanese candles. They remove the noise from the charts and help to identify an establish trend. This is all you will need on your charts to join the profitability side alongside the required chart time to really master this approach. Before we continue, you must understand that trading is the hardest way to make easy money. And it will take you years to really master all the aspects of trading to make this easy money. If you are hoping for overnight success or think this is the Holy Grail to your trading inconsistency look elsewhere.
It is a proven statistic that 90-95% of traders will lose money in the markets and yet I only see winners on Instagram (social media.) Most, if not all of these so called Forex gurus make money selling a service than by actually trading. Trading is risky, teaching how to trade is risk-free which is the reason why so many gurus out there are ready to turn you into the next millionaire. They have realized it is more profitable to teach you and provide you a signal where your money is at risk, not theirs. They are marketers that capitalize on the fact that trading is an extremely challenging profession and a struggling trader is holding on dearly to the idea of overnight success. Everyone is teaching but no one is providing a monthly statement or all weekly trading setups taken with results. Instead, I see Demo accounts (heck sometimes photoshopped statements!) and luxury cars that fool the new trader into thinking consistency is easily attainable.

Most struggling traders have not even tested their strategy for positive expectancy. That simply means, examining a data of a large sample of trades that you have taken with your defined strategy for a conclusive result. All technical analysis books educate the reader in hindsight. Hindsight does not make you money. The proof is 95% of traders fail. Why? One reason is because they are being taught to place their entries in places where the smart money (banks and large institutions) are placing theirs orders that need to be filled. So it does not matter how much time you spend educating yourself and how many hours you put behind the charts because your brain has been wired to trade poorly. Do you trade falling wedges and indicators with consistency? Are you really making money month after month (which means your winnings months profit exceeds a losing month or two losses to cover a bad run?) I didnt think so. I certainly have had a few losing months over the last two years, but my winnings far exceed those losses.

Trading is about protecting your capital and adhering to a strict risk management plan and deploying your assets (money) when your edge is present at the current market conditions. Trading is not about flipping accounts. Lets be serious. The results that you see on Instagram, have you ever wondered how all 20-25 year olds there have $50,000, $100,000, $500,000 available to yield those types of returns if he was doing it in a safe and smart manner?
I don't have a crystal ball and I don't post only winning trades. This month actually has been in red for me so far. But this is the reality of trading and when you only see statements in green something is not right.
The blueprint of trading is price, supply and demand, support and resistance, and the trend and is all based on PRICE ACTION ONLY! This is all I need to make my trading decisions from a top-down approach. Now, I have molded my craft over the years in a way that works for me. Everyone has a different perspective and that is fine, you must mold a craft that works for you, but the blueprint is still the same.

This thread is not going to be repetitive on what you find in abundance in most TA books or have easily accessible on the Internet. This thread is based on my actual strategy that I have tested with positive expectancy for the last two years. I will go in depth on my interpretation of the charts and tell my story. I will explain how I built a case on every single trade I take by identifying the trend, where the current selling and buying is happening (demand and supply), and locating the resistance and support levels price has reacted to. Its that simple. If this is your first day in Forex, I insist you go through babypipss school to learn the dynamics of the market. You must also be able to differentiate that just because I am very successful with my approach does not mean you will have the same positive expectancy. Why is that? Simply because of perception like we talked earlier and more importantly behind my results are also 11 years of market exposure. Use the content found in this thread to enhance your interpretation of the charts and find out what works for you, this is paramount. It will require extreme efforts on your part. I want to show the world what real trading looks like. That means all my entries/exits (charts) for the week, statements at the end of the month. Stay tune, this will be a very active thread.

NOTE *this is NOT a signal service. You must learn to make your own trading decisions*

Thanks
Stefan
  • Post #2
  • Quote
  • May 29, 2017 9:23am May 29, 2017 9:23am
  •  limzy
  • Joined Jul 2014 | Status: Member | 191 Posts
Quoting flylife
Disliked
I have been trading the foreign exchange market for the last eleven years. Over the last two years my trading has been consistent and profitable using the same strategy over and over again.
Ignored
Dear Stefan,

Thank you for inspiring us all.
  • Post #3
  • Quote
  • May 30, 2017 4:07am May 30, 2017 4:07am
  •  aazishhunain
  • | Joined Dec 2014 | Status: Struggler | 86 Posts
Thank you Stefan for your time to explain things.

Waiting for your next posts.

Aaz
  • Post #4
  • Quote
  • May 30, 2017 4:52am May 30, 2017 4:52am
  •  flylife
  • | Commercial Member | Joined Jan 2014 | 56 Posts
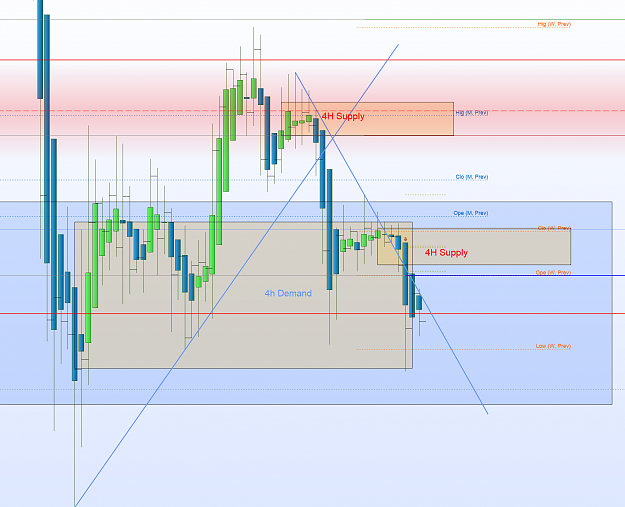
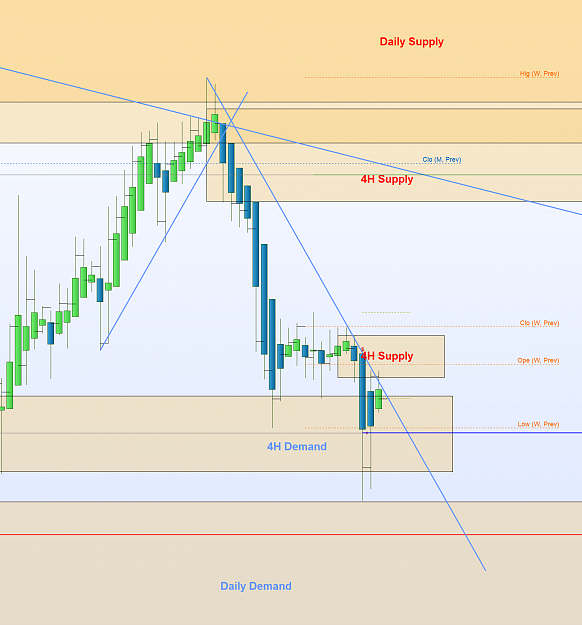
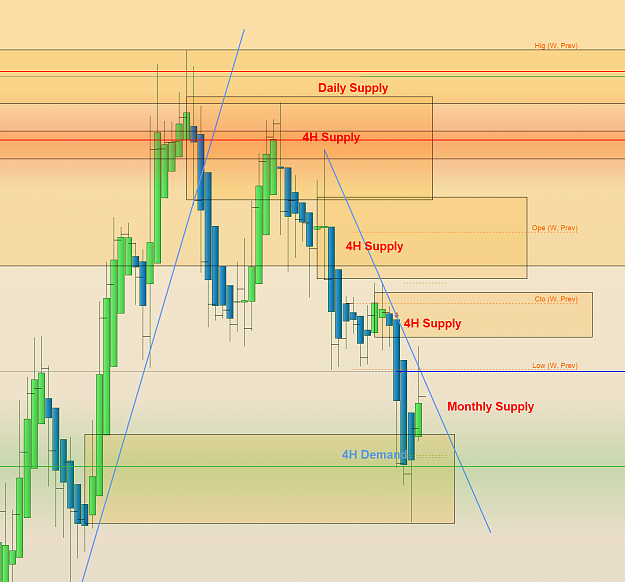
Hi guys, so first trade on EURJPY

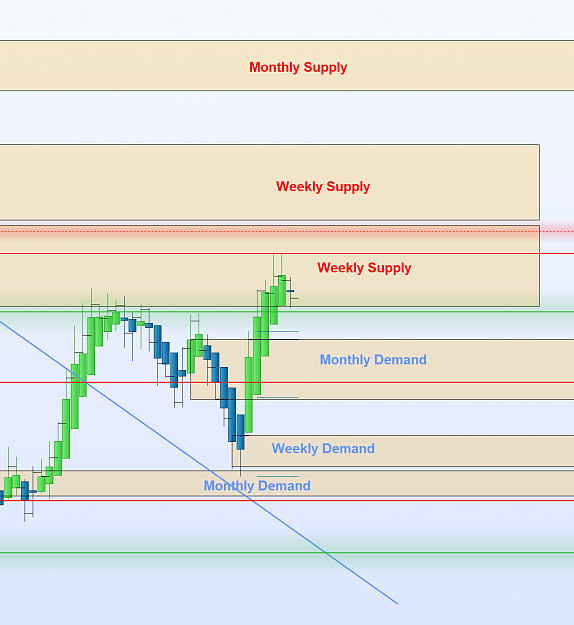
I start drawing my Support and Resistance lines, Trend and Supply and Demand zones on all the time frame.

On the monthly we have strong Demand in control but we have a big resistance line that has been rejected in the past. Based on that I liked the idea for a short sell opportunity
Attached Image (click to enlarge)
Click to Enlarge

Name: monthly.PNG
Size: 55 KB

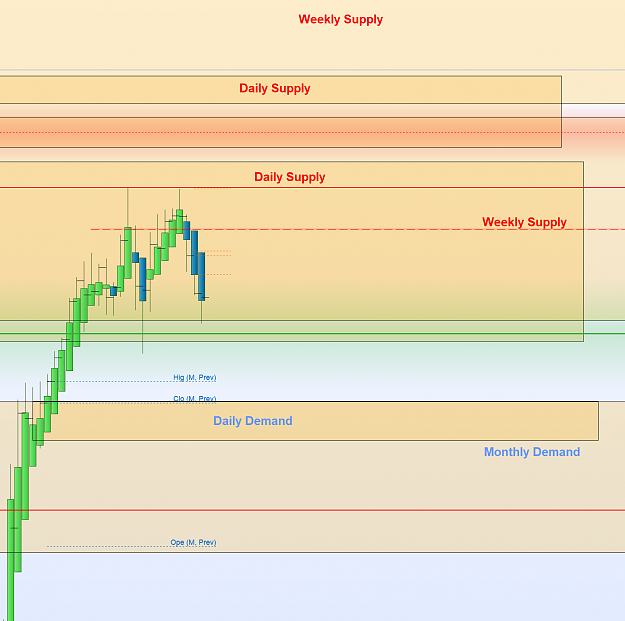
On the Weekly we have a supply zone in control and we can see the price rejecting that big resistance line, last week close was also lower than the previous week close
Attached Image (click to enlarge)
Click to Enlarge

Name: Weekly.PNG
Size: 55 KB

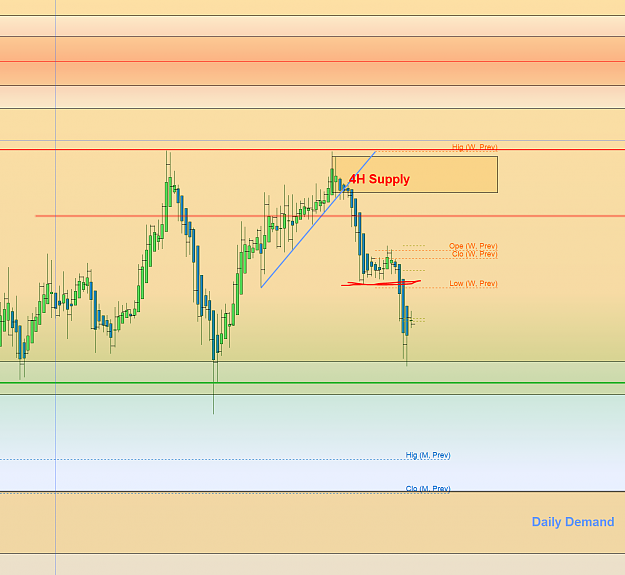
On the daily also have a supply zone in control that is nested inside the weekly one and we can see the rejection on that resistance level, also the price made a lower high. So based on all these I've decided to go short on the break of previous daily low
Attached Image (click to enlarge)
Click to Enlarge

Name: DailyPNG.PNG
Size: 49 KB

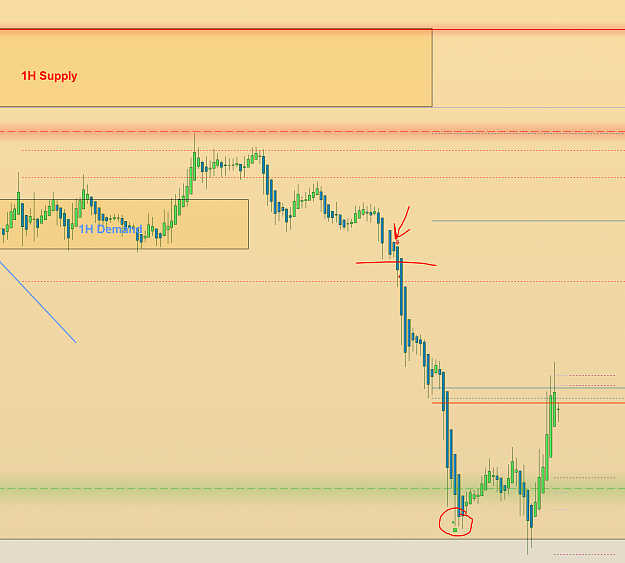
On the 4H time frame you can see exactly where I went short. Also a small trend line has been broken. Also at that level was the low of the previous week a well.
So over all was a lot of pressure from above time frame to sell.
Attached Image (click to enlarge)
Click to Enlarge

Name: 4H.PNG
Size: 58 KB

And target was achieved today for 100 pips
Attached Image (click to enlarge)
Click to Enlarge

Name: 15min.PNG
Size: 55 KB


So as you can see I don't use any indicators, just price action, support and resistance, trend and most important supply and demand. I do a top down analysis to know exactly who is in control. Support and demand aren't just the rectangles that recently people are starting to draw on their charts. Supply and demand is more than that. For every buyer there is a seller and for every seller there is a buyer. When the price is going down somebody is buying. Supply is forming while participants are still buying, before the turning point. In most of my trades lets say a selling opportunity I am positioning myself while market participants are still buying.

That's all for today!

The more question you have the more I can go in details
Thanks
Stefan
  • Post #5
  • Quote
  • May 30, 2017 6:40am May 30, 2017 6:40am
  •  CoolRain
  • | Joined Feb 2016 | Status: Member | 175 Posts
Hello Stefan,
Nice to see one more user that trade with the Supply & Demand.
I will watching Your thread.

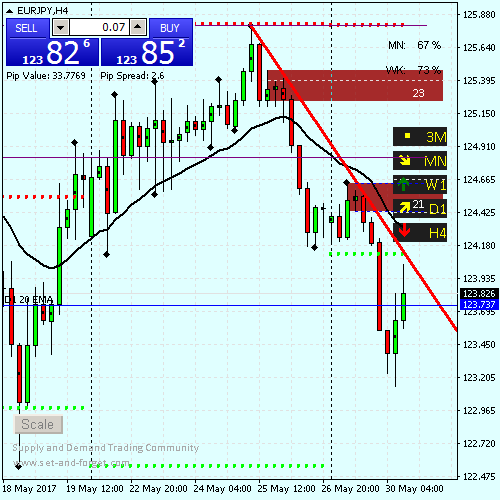
I'm also S&D trader and for the EUR/JPY I now wait on retest the H4 Supplys zones to more shorts.
Attached Image
Supply & Demand trading
  • Post #6
  • Quote
  • May 30, 2017 6:59am May 30, 2017 6:59am
  •  flylife
  • | Commercial Member | Joined Jan 2014 | 56 Posts
Quoting CoolRain
Disliked
Hello Stefan, Nice to see one more user that trade with the Supply & Demand. I will watching Your thread. I'm also S&D trader and for the EUR/JPY I now wait on retest the H4 Supplys zones to more shorts. {image}
Ignored
Great CoolRain, I am looking at the same level again for a short

Right now I am short on USDJPY as well for similar reasons like EURJPY. Can be shorted again on the pull back to that supply zone on 4H. USD news tonight and might affect the move but I don't really care once I am in the trade. Stop is in place above the recent highs on the 4H

Attached Image (click to enlarge)
Click to Enlarge

Name: USDJPY 4H.PNG
Size: 146 KB
  • Post #7
  • Quote
  • May 30, 2017 7:02am May 30, 2017 7:02am
  •  flylife
  • | Commercial Member | Joined Jan 2014 | 56 Posts
Quoting CoolRain
Disliked
Hello Stefan, Nice to see one more user that trade with the Supply & Demand. I will watching Your thread. I'm also S&D trader and for the EUR/JPY I now wait on retest the H4 Supplys zones to more shorts. {image}
Ignored
And the same 4H chart on AUJPY, I am in to this trade as well, just reacted to the 4H supply and higher time frame supply is in control

Attached Image (click to enlarge)
Click to Enlarge

Name: AUDJPY 4H.PNG
Size: 97 KB
  • Post #8
  • Quote
  • May 30, 2017 7:07am May 30, 2017 7:07am
  •  flylife
  • | Commercial Member | Joined Jan 2014 | 56 Posts
EURUSD 4H as well, similar situation. I am in this short as well

Lots of supply pressure from above. Is looking good atm but tonight news and NFP can change all these nice setups

Attached Image (click to enlarge)
Click to Enlarge

Name: EURUSD 4H.PNG
Size: 133 KB
1
  • Post #9
  • Quote
  • Jun 14, 2017 8:11am Jun 14, 2017 8:11am
  •  HarmonicBoy
  • | Joined Jan 2011 | Status: Member | 19 Posts
Hi Stefan, thank you for your posts here. I have never considered supply and demand in any serious way before, only PA, S/R lines, EMA's which I really do like, and a couple of the typical indicators. I love Heiken Ashi also and use these on all my charts.
It makes sense to me that supply/demand should be considered so you have my interest.

I can see you have not posted in a while but will continue to watch and subscribe to this thread with interest in the hope you reignite it. I'm in Auckland btw.
Mark
  • Post #10
  • Quote
  • Jun 14, 2017 10:38am Jun 14, 2017 10:38am
  •  mtharwat
  • | Joined Aug 2015 | Status: Member | 448 Posts
Good Day,

I am one of the biggest supporters of Price Action. I am just not sure if this thread would welcome non time based charts including range brs, renko, etc..

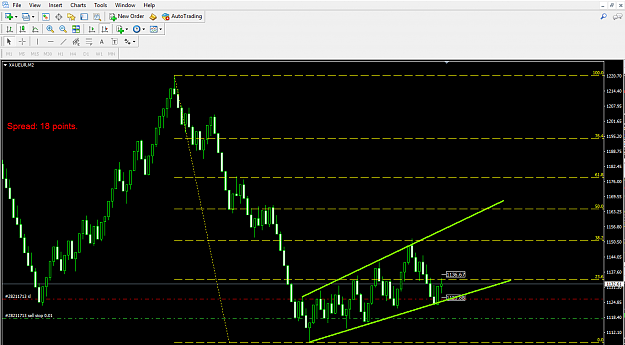
For the mean time I have attached a range bar chart of XAU EUR (80 pips).

PA is in a downtrend and tested fib 38.2 level and iis trading in a broadening formation. The pattern is an inverted flag pattern and the pair will be sold when price penetrates through the lower trend line.

The target is determined based on t range bar size of 160 pips (not shown in the attached one)
Attached Image (click to enlarge)
Click to Enlarge

Name: Screenshot1.png
Size: 61 KB
  • Post #11
  • Quote
  • Jun 14, 2017 10:44am Jun 14, 2017 10:44am
  •  mtharwat
  • | Joined Aug 2015 | Status: Member | 448 Posts
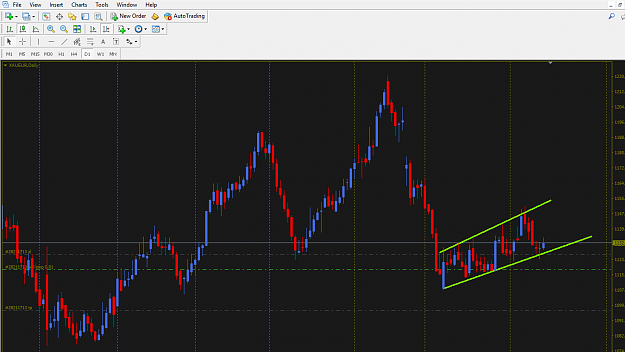
Same pair with candlesticks on daily time frame.
Attached Image (click to enlarge)
Click to Enlarge

Name: Screenshot1.png
Size: 56 KB
  • Post #12
  • Quote
  • Jun 15, 2017 7:15am Jun 15, 2017 7:15am
  •  HarmonicBoy
  • | Joined Jan 2011 | Status: Member | 19 Posts
Interesting that you mention Renko charts Mtharwat. These comprise 95% of my charting and I receive much greater consistency when I ignore time. I don't think I could go back to standard charts again. I'm looking to see if this supply and demand concept could support my charting preference. Still evaluating. Certainly very interesting.
  • Post #13
  • Quote
  • Jun 15, 2017 1:57pm Jun 15, 2017 1:57pm
  •  mtharwat
  • | Joined Aug 2015 | Status: Member | 448 Posts
Hello Harmonic Boy. It's great that you prefer non time charts. I myself like to trade renko, better renko and range bars; with and without indicators.

You are definitely on the right track.

I just need to ask you one thing:

My understanding of supply/demand is a support/resistance ZONES. When I don't find a clear straight line for support/resistance, I draw zones (I use the rectangle drawing tool) instead for tops and bottoms. This will definitely make me cautious when price tests the water in those zones. Then when I lower the box size, I fine tune these zones.
Is this what you mean by supply/demand or is their something else you have in mind?
  • Post #14
  • Quote
  • Jun 15, 2017 6:30pm Jun 15, 2017 6:30pm
  •  HarmonicBoy
  • | Joined Jan 2011 | Status: Member | 19 Posts
Its good to meet another renko trader. I was beginning to feel like someones reprobate uncle that never gets invited to family dinners lol.
99% of the content on the FF website is for time based analysis. Its amazing how this analysis so easily transposes to Renko and how ignoring time chops out so much noise. I have to admit I tried using Renkos three times before I finally "got it". Perhaps I'm just slow :-)

My own understanding of supply and demand so far - until others can enlighten me further - is simple S&R. Like you I treat all S/R areas as zones, never absolutes. Once I saw it like this it had me understand the price movements way way better. The markets don't stop and retrace on a "line", only an area/zone. And anyone that looks at time based charts i'm sure would agree that the higher up you go time wise, potentially the wider the zone. Draw an S/R line on a daily chart and it would be one consideration, drop down to a 60 min chart and it may comprise 2/3 nested zones etc etc. Flylife/Stefan, our thread originator I think was alluding to this in this thread.

With Renko you change brick sizes and the whole chart changes, but the PA and S/R analysis still holds. EMA's are another form of S/R, only more fluid and as I see it - a more dynamic way of expressing sentiment to my mind.

I've been trying to use volume as another recent addition as I have wanted to get my head around institutional trading better. This money movement would be better seen in Renko theoretically, but I have yet to see a correlation that I can eyeball and use as an edge. Maybe someone else can help here.

I haven't ever dived into range bars properly. What benefits do you see with these over Renko Mtharwat? Using both you'd have a good knowledge of the benefits of each one.
  • Post #15
  • Quote
  • Jun 16, 2017 11:14pm Jun 16, 2017 11:14pm
  •  mtharwat
  • | Joined Aug 2015 | Status: Member | 448 Posts
I will reply to you shortly.
We will be the best renkoholic buddies!
  • Post #16
  • Quote
  • Jun 17, 2017 1:57am Jun 17, 2017 1:57am
  •  mtharwat
  • | Joined Aug 2015 | Status: Member | 448 Posts
Iam writing from my phone. Sorry for spelling mistakes.

1- Range bars are better for ranging markets to identify support/ resistance. I need to enter the trade before waiting for a renko brick with double size to signal a rebound from support/resistance.
I prefer to see two or three range bars forming a congestion. Also the stop loss will be placed much narrower rather than twice the size of a renko box.

2- Range bars are better when price plays around a trend line, or breaking a trend line. They give you better positioning and show the 'fight' between bulls and bears rather than couple of renko bricks.


3- gives indicators a better chance to develop, mature and give signals. For example a retracement in a downtrend will be more obvious in stochastics heading to over bought area and then crossing back downwards.
Also divergence will be more obvious/reliabe as there will be more bars.

For example:
In case of a double top in PA and MACD is diverting:
In a renko chart, sometimes you see two peaks with just one box each with long wicks showing the first and second attempts to break the resistance

In range bars, you would see two peaks with more than one bar in each.

This gives me as a trader a visual confirmation of distribution conbined with an indicator divergence.

Another example:
In a down trend, i want to enter in a retracement that has tested a fibo level and is showing a big number of bars trying to break this tight upward slopy range. Also i want the indi to respond to those range bars and get into an oversold area.

----------------------
Now is a question:

Are range bars better than renko ?

I define myself as a chartist. Visuality is my goal. I dont follow a system. I want good old basic patterns.
What ever chart type that could give me this clear visuality is my favourite.

-------------
In short, i started trading BECAUSE of renko and by time i started to delve more in mean renko, point O Chart ( google it as u will love it), and even point and figure.
With the later, i know how to calculate the targets and interpret the patterns but has not got an edge. Still too hard for me.

My ultimate goal is to trade pure PA without the influence of even a single 20 EMA.

Using an array of Non time charts with or without time charts will definitely make you the best chartist ever.

By the way have a good read of renkotraders website. It is the only one I have found so far for real renko trading.

It does not totally satisfy me with trading pure PA but still the best u can find in renko trading.

----------
With diversification , there will be more PA signals and I will try to post many examples.
  • Post #17
  • Quote
  • Jun 17, 2017 2:40am Jun 17, 2017 2:40am
  •  mtharwat
  • | Joined Aug 2015 | Status: Member | 448 Posts
Hello flylife,
Thanks for the thread.
Are you ok with posting non time charts. If not, its ok and I will be happy to share here time charts,
Thanks
  • Post #18
  • Quote
  • Jun 18, 2017 4:16am Jun 18, 2017 4:16am
  •  HarmonicBoy
  • | Joined Jan 2011 | Status: Member | 19 Posts
Hi Mtharwat,
I will look more closely at range bars. A good trading friend in Bangladesh swears by them but I have tried to concentrate on Renkos. They do have their limitations mind, for example a 10 brick size renko bar can go -19 pips before registering a renko bar in the opposite direction. It really does seem to need good money management to stay on top of it.
I'm trying multiple brick sizes to determine entry points, a 4, a 6 and a 10. At the moment I am finding a combination EA configuration quite helpful for entries with a trailing stop.

Thanks for the renkotraders website pointer. I'm reading it as I type this. If you want to chat further PM me and we can skype maybe and see if we can maybe build something good
  • Post #19
  • Quote
  • Jun 18, 2017 4:28am Jun 18, 2017 4:28am
  •  flylife
  • | Commercial Member | Joined Jan 2014 | 56 Posts
Hi guys, renko, range bars, heiken ashi...anything that cut the noise from the standard candlestick charts is good. I personally use heiken ashi.
  • Post #20
  • Quote
  • Jun 18, 2017 4:38am Jun 18, 2017 4:38am
  •  flylife
  • | Commercial Member | Joined Jan 2014 | 56 Posts
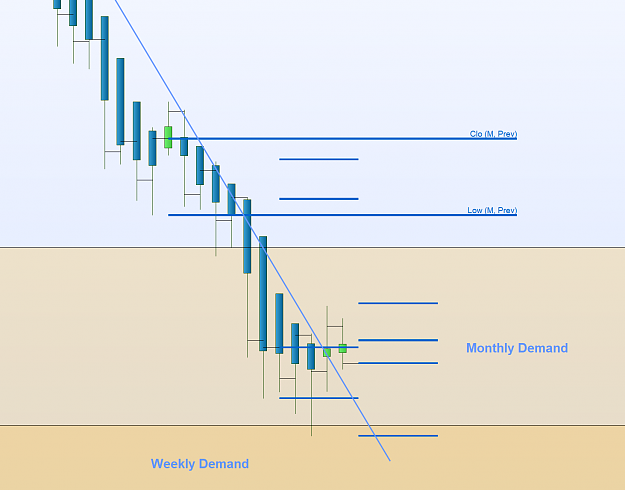
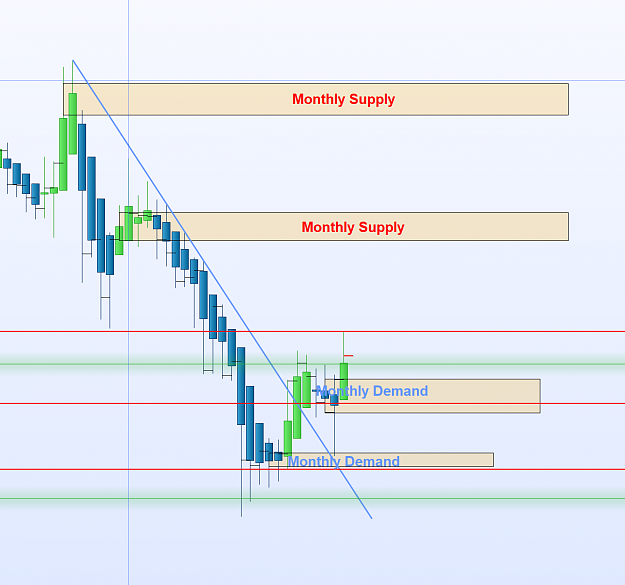
I am looking for some longs on GBPNZD at the moment:

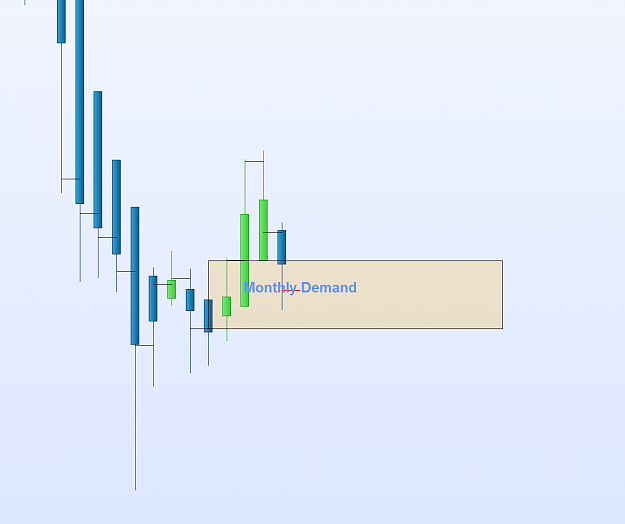
On the monthly the price sits in a demand zone
Attached Image (click to enlarge)
Click to Enlarge

Name: monthly.PNG
Size: 20 KB


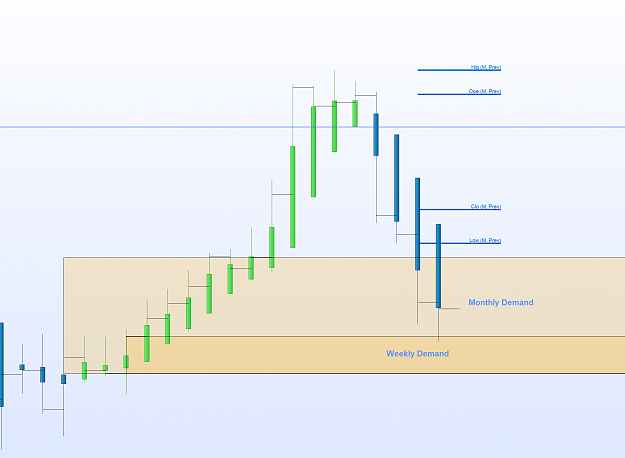
On the weekly very similar, the price is reacting to a weekly demand zone
Attached Image (click to enlarge)
Click to Enlarge

Name: weekly.PNG
Size: 45 KB


On the daily downtrend line has been broken
Attached Image (click to enlarge)
Click to Enlarge

Name: daily.PNG
Size: 43 KB


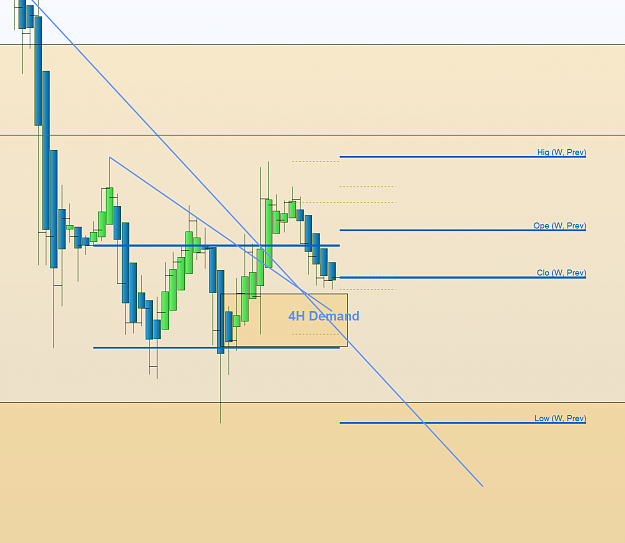
And on the 4H I am waiting for the price to pull back in to the 4H demand where I am going to take some longs.
Attached Image (click to enlarge)
Click to Enlarge

Name: 4H.PNG
Size: 62 KB
Thread Tools Search this Thread
Show Printable Version Show Printable Version
Email This Thread Email This Thread
Search this Thread:

Advanced Search

  • Commercial Content
  • /
  • Sell Supply Buy Demand Price Action Trading
  • Reply to Thread
    • Page 1 2
    • Page 1 2
0 traders viewing now
  • More
Top of Page
  • Facebook
  • Twitter
About FF
  • Mission
  • Products
  • User Guide
  • Media Kit
  • Blog
  • Contact
FF Products
  • Forums
  • Trades
  • Calendar
  • News
  • Market
  • Brokers
  • Trade Explorer
FF Website
  • Homepage
  • Search
  • Members
  • Report a Bug
Follow FF
  • Facebook
  • Twitter

FF Sister Sites:

  • Metals Mine
  • Energy EXCH
  • Crypto Craft

Forex Factory® is a brand of Fair Economy, Inc.

Terms of Service / ©2019