I've been looking for a good Support Resistance / Supply Demand indicator for a very lonnngggggg time. Found one in another forum today, so I just had to share it here on FF.
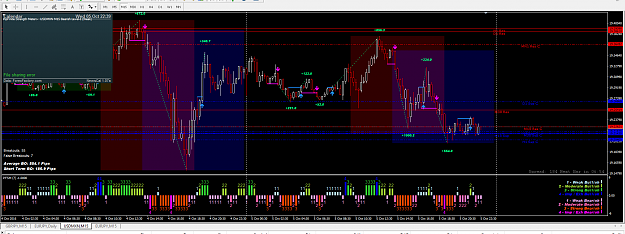
Nice thing about this one is it displays multiple time frame SD on your chart. No going back and forth! And you can change settings to just show the SD TF's you want It's the horizontal red and blue lines.
I'm using this with my breakout indicator and Strength meter. Did over 200 pips today. So I'm happy
Enjoy!
Nice thing about this one is it displays multiple time frame SD on your chart. No going back and forth! And you can change settings to just show the SD TF's you want
I'm using this with my breakout indicator and Strength meter. Did over 200 pips today. So I'm happy
Enjoy!
Attached Image (click to enlarge)
Attached File(s)