Hi,
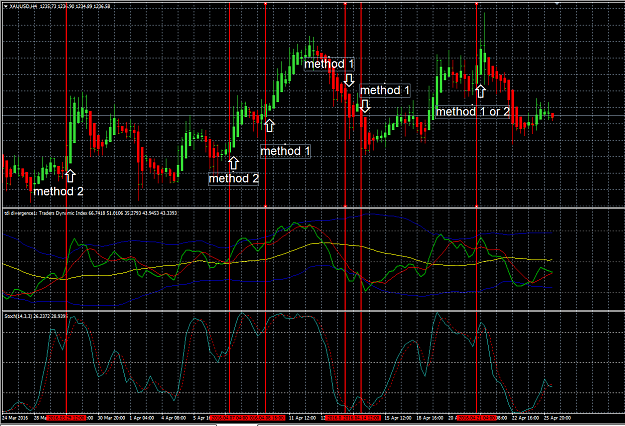
About few months ago I read a thread which is called " Trading Made Simple" . They used TDI indicator and TMS to monitor charts and find possible entries. I tried this system for some months but I gained 40% success from their system. I tried to modify the system to find out higher potential entries. Following I will explain my strategy which can be used for newbies of TDI system.
I personally prefer to use method 1 for daily chart, as I need to only check the charts at the start of the day and open possible positions and leave it until the end of the day. So it is stress free strategy. However, both method 1 and 2 can be used for 4H if you like to monitor graphs during the day.
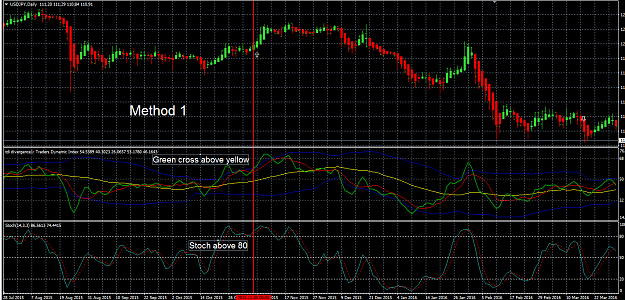
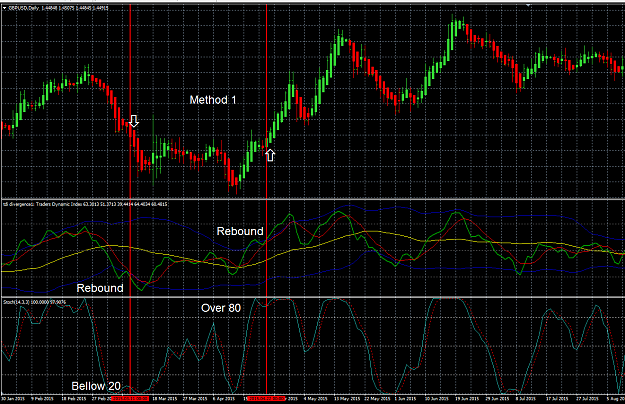
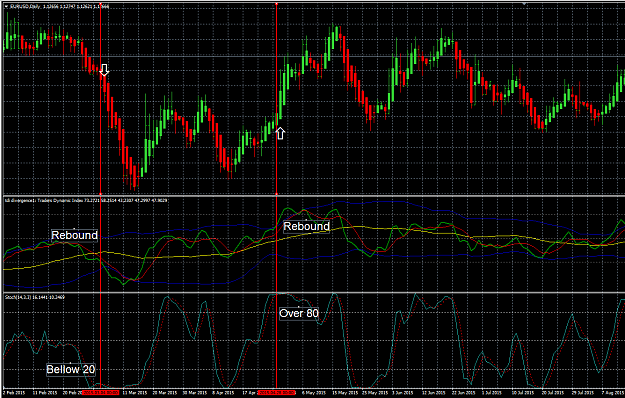
Method 1 :
At the beginning of the day, I will check all 28 pairs for possible entries based on the following rules:
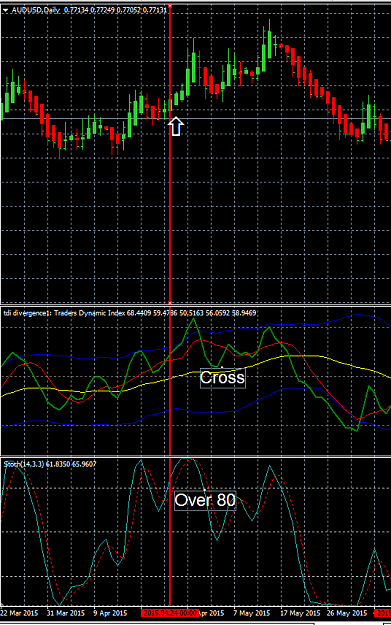
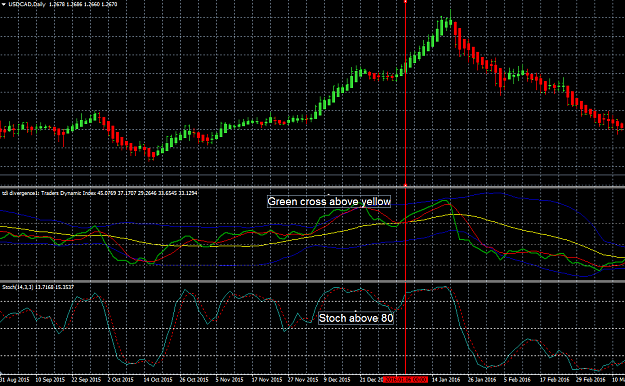
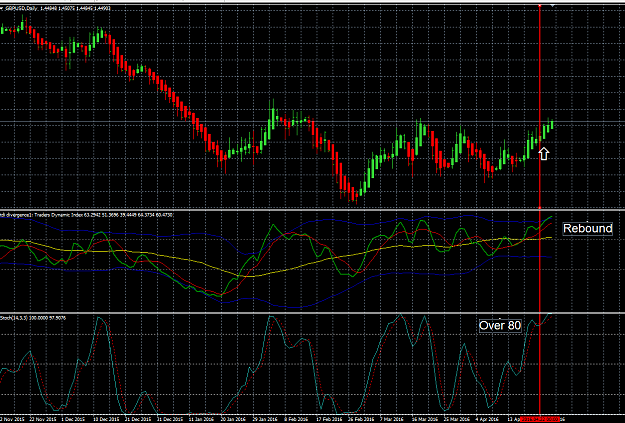
BUY:
1) Stochastic : Should be over 80
2) TDI : a) Green should cross above the red line or show a rebound b) prefer that cross or rebound happened above the yellow line.
Sell:
1) Stochastic : Should be bellow 20
2) TDI : a) Green should cross bellow the red line or show a rebound b) prefer that cross or rebound happened bellow the yellow line.
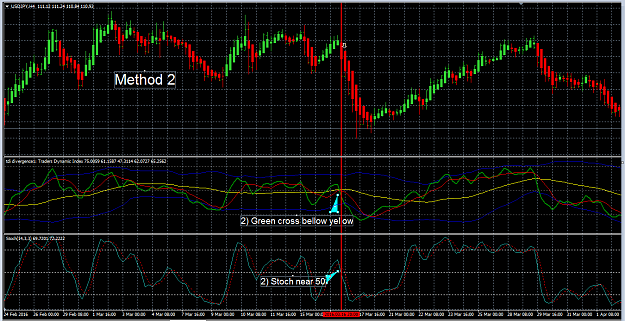
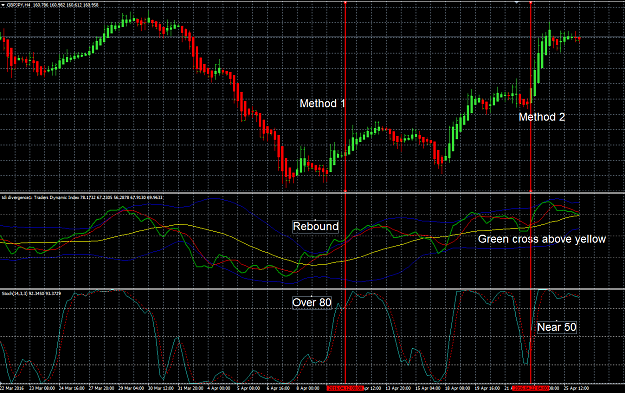
Method 2:
If I want to look at 4H charts for more entries, ( usually when I do not have any entries from method 1 at the beginning of the day), during the day , I will follow the bellow rules:
1) Check method 1 for possible entries on chart 4H
or
2) BUY:
2-1) Stochastic : near or above 50
2-2) TDI : a) looking for cross or rebound but where it is near or above yellow line b) cross or rebound upward
3) SELL:
3-1) Stochastic : near or BELLOW 50
3-2) TDI : a) looking for cross or rebound but where it is near or BELLOW yellow line b) cross or rebound DOWNWARD
I will add charts to clarify the strategy.
These methods provided 80% successful entries for me !!!!! You can back test from history data to check the possible entries.
Comments are welcome......
About few months ago I read a thread which is called " Trading Made Simple" . They used TDI indicator and TMS to monitor charts and find possible entries. I tried this system for some months but I gained 40% success from their system. I tried to modify the system to find out higher potential entries. Following I will explain my strategy which can be used for newbies of TDI system.
I personally prefer to use method 1 for daily chart, as I need to only check the charts at the start of the day and open possible positions and leave it until the end of the day. So it is stress free strategy. However, both method 1 and 2 can be used for 4H if you like to monitor graphs during the day.
Method 1 :
At the beginning of the day, I will check all 28 pairs for possible entries based on the following rules:
BUY:
1) Stochastic : Should be over 80
2) TDI : a) Green should cross above the red line or show a rebound b) prefer that cross or rebound happened above the yellow line.
Sell:
1) Stochastic : Should be bellow 20
2) TDI : a) Green should cross bellow the red line or show a rebound b) prefer that cross or rebound happened bellow the yellow line.
Method 2:
If I want to look at 4H charts for more entries, ( usually when I do not have any entries from method 1 at the beginning of the day), during the day , I will follow the bellow rules:
1) Check method 1 for possible entries on chart 4H
or
2) BUY:
2-1) Stochastic : near or above 50
2-2) TDI : a) looking for cross or rebound but where it is near or above yellow line b) cross or rebound upward
3) SELL:
3-1) Stochastic : near or BELLOW 50
3-2) TDI : a) looking for cross or rebound but where it is near or BELLOW yellow line b) cross or rebound DOWNWARD
I will add charts to clarify the strategy.
These methods provided 80% successful entries for me !!!!! You can back test from history data to check the possible entries.
Comments are welcome......