• Home
  • Forums
  • Trades
  • News
  • Calendar
  • Market
  • Brokers
  • Login
  • Join
  • User/Email: Password:
  • 4:12pm
  • Search
Menu
  • Forums
  • Trades
  • News
  • Calendar
  • Market
  • Brokers
  • Login
  • Join
  • 4:12pm
Search
Sister Sites
  • Metals Mine
  • Energy EXCH
  • Crypto Craft

Options

Search
Search
Search

Bookmark Thread

First Page First Unread Last Page Last Post

Printable Version

Similar Threads

Pharley Simple system - Get your levels right for trading S/R 532 replies

The Support Resistance Switch Method - Trade with one line 90 replies

My method is based on Support and resistance. 5 replies

New support/resistance method - Help Needed! 5 replies

  • Trading Systems
  • /
  • Reply to Thread
  • Subscribe
  • 317
Attachments: Support and Resistance Method - Pharley
Exit Attachments

Support and Resistance Method - Pharley

  • Last Post
  •  
  • Page 1 23456 36
  • Page 1 234 36
  •  
  • Post #1
  • Quote
  • First Post: Edited Sep 1, 2015 6:59pm Aug 1, 2015 6:24pm | Edited Sep 1, 2015 6:59pm
  •  pharley
  • Joined Apr 2013 | Status: Member | 594 Posts
This method is below in the first few posts, or in a nutshell at Post 185 on Page 10.

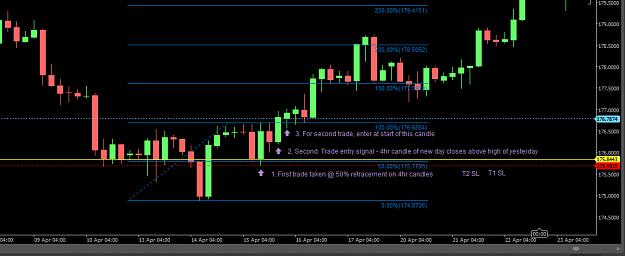
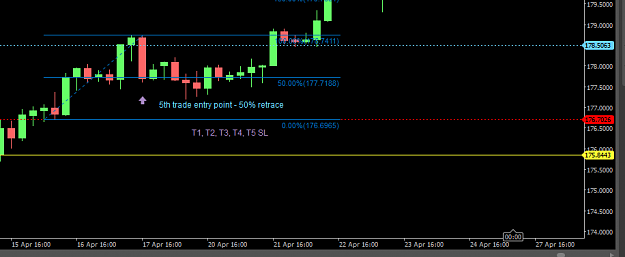
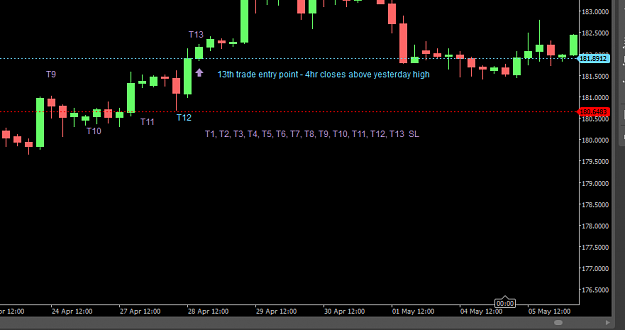
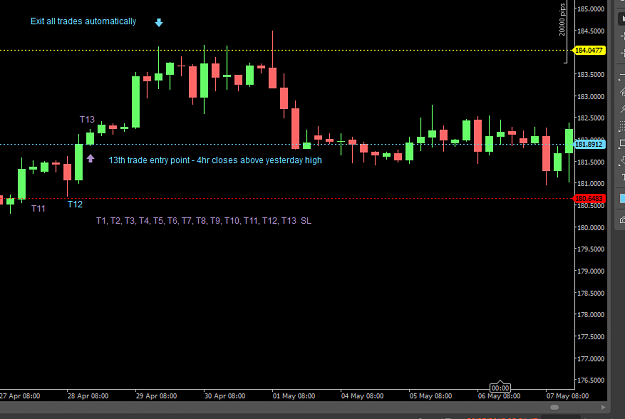
Live trades taken with result of +60% account growth in 1 trade run starts at Post number 176 on page 9.


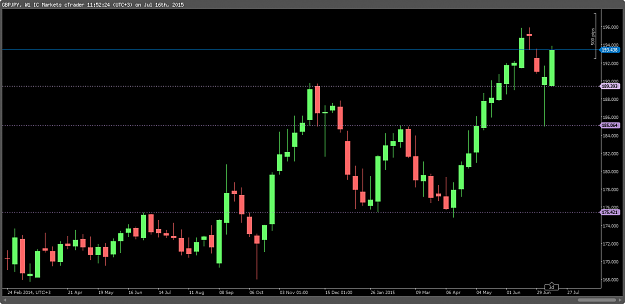
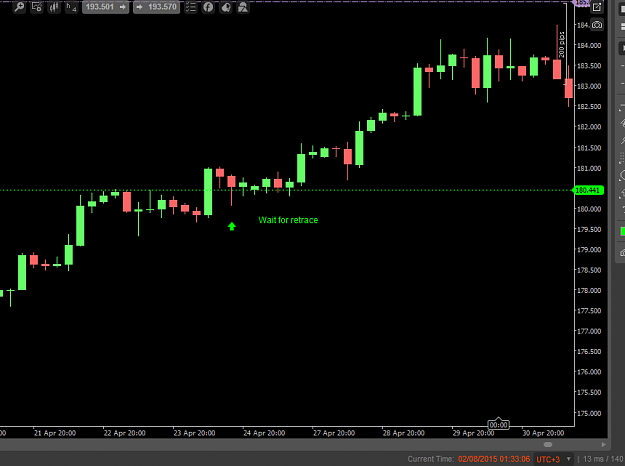
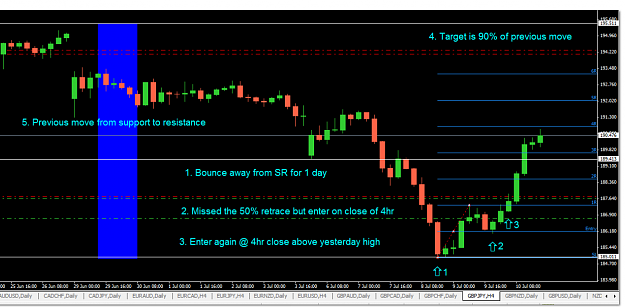
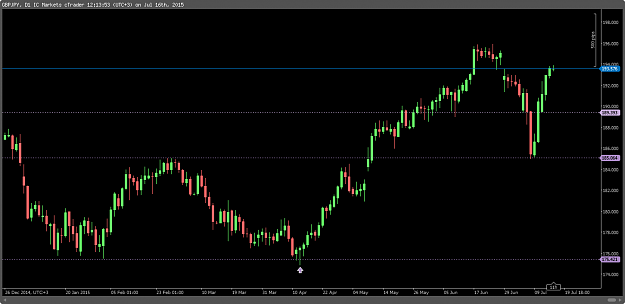
1. Weekly candle chart - Draw in areas/lines of SR:
Attached Image (click to enlarge)
Click to Enlarge

Name: 1. Weekly SR GBPJPY example.png
Size: 20 KB
  • Post #2
  • Quote
  • Aug 1, 2015 6:26pm Aug 1, 2015 6:26pm
  •  pharley
  • Joined Apr 2013 | Status: Member | 594 Posts
2. Daily chart (same time period) - move to daily candle chart and watch candle price action and SR area - pin bar at support formed:
Attached Image (click to enlarge)
Click to Enlarge

Name: 2a. Daily SR GBPJPY example.png
Size: 20 KB
  • Post #3
  • Quote
  • Aug 1, 2015 6:27pm Aug 1, 2015 6:27pm
  •  pharley
  • Joined Apr 2013 | Status: Member | 594 Posts
3. Set up target area - I use a modified Fib just for measuring. I take 90% of the previous move as the target:
Attached Image (click to enlarge)
Click to Enlarge

Name: 3. Price target on daily.PNG
Size: 45 KB
  • Post #4
  • Quote
  • Aug 1, 2015 6:28pm Aug 1, 2015 6:28pm
  •  pharley
  • Joined Apr 2013 | Status: Member | 594 Posts
4) 4hr entries - I move to 4hr candle and look for my first entry. This one is a 50% retracement entry. All targets for multiple trades at at my target level (see 3 above):
Attached Image (click to enlarge)
Click to Enlarge

Name: 4. Trade 1 - 4hr 50% retracement.PNG
Size: 28 KB
  • Post #5
  • Quote
  • Aug 1, 2015 6:30pm Aug 1, 2015 6:30pm
  •  pharley
  • Joined Apr 2013 | Status: Member | 594 Posts
5) Second entry - on the 4hr candles. I wait until the first 4hr candle closes above yesterdays high. SL from trade 1 is move up to where SL for T2 will be:
Attached Image (click to enlarge)
Click to Enlarge

Name: 5. Trade 2 - 4hr entry candle.PNG
Size: 30 KB
  • Post #6
  • Quote
  • Aug 1, 2015 6:34pm Aug 1, 2015 6:34pm
  •  pharley
  • Joined Apr 2013 | Status: Member | 594 Posts
6) I keep entering on 50% retracements and either a 4hr candle closing above yesterday high, or wait until a break above the high comes back to retest the break point.
Attached Image (click to enlarge)
Click to Enlarge

Name: 4hr wait for retrace.PNG
Size: 24 KB
  • Post #7
  • Quote
  • Edited at 7:31pm Aug 1, 2015 6:36pm | Edited at 7:31pm
  •  pharley
  • Joined Apr 2013 | Status: Member | 594 Posts
Approach is:

1) Weekly chart, draw major SR levels
2) Daily chart - wait for price to come to those areas. Look for PA candles - Pin Bars etc
3) 4hr for entries on 50% retraces, confirmed higher breaks, or retraces back to break points
4) Set SL at logical positions - normally last swing H or L
5) Move SL up (or down) to the new trade SL point - this locks in profits
6) Target is the same for all trades - Measure the last move between S and R and take 90% as a target
7) Enter multiple times - Each time I get my SL up to the latest trade, I'm locking in profits. Most importantly my risk is remaining constant.
8) For the very first trade of a move, I only risk half of my normal risk - this is because price can do anything, and it may go against me
9) once price moves in my favour I enter at my normal risk level
10) If I have multiple trades open and they are at risk, the total risk only adds up to my overall risk level
11) I stop trading the run when reward to risk gets lower than about 2 to 1
12) Sometimes I will enter on continuation candles during the run - inside bars, pins, but I try and keep it as simple as possible
1
  • Post #8
  • Quote
  • Aug 1, 2015 6:41pm Aug 1, 2015 6:41pm
  •  pharley
  • Joined Apr 2013 | Status: Member | 594 Posts
I use a position calculator (from Babypips) to calculate lot sizes based on SL position and my risk level.
My risk I take in $ and not so much %. I can live off $ but not % !

It's nothing new, nothing complex. I'm not reinventing the wheel. I'm just applying basic price action to enter multiple times on a run - that's where you can get thousand of pips from a 500 to 800 pip run.

Normally the reward to risk for the early trades is around 8 or 10 to 1.

I started the thread because I've been posting in the Rookies section to help a few there - it's about time I brought it together in 1 place! Less confusing for this ancient brain!
2
  • Post #9
  • Quote
  • Aug 1, 2015 6:49pm Aug 1, 2015 6:49pm
  •  pharley
  • Joined Apr 2013 | Status: Member | 594 Posts
Here's another slightly later trade taken - another 50% retrace. Notice stops have moved up:
Attached Image (click to enlarge)
Click to Enlarge

Name: 8. Trade 5 - 50% retrace.PNG
Size: 16 KB
  • Post #10
  • Quote
  • Aug 1, 2015 6:53pm Aug 1, 2015 6:53pm
  •  pharley
  • Joined Apr 2013 | Status: Member | 594 Posts
Here is trade number 13 taken on the same run, and my last for this run:
Attached Image (click to enlarge)
Click to Enlarge

Name: 16. Trade 13 - 4hr candle closes above yesterday high.PNG
Size: 18 KB
  • Post #11
  • Quote
  • Aug 1, 2015 6:54pm Aug 1, 2015 6:54pm
  •  pharley
  • Joined Apr 2013 | Status: Member | 594 Posts
And the exits:
Attached Image (click to enlarge)
Click to Enlarge

Name: 17. Trade exits.PNG
Size: 25 KB
  • Post #12
  • Quote
  • Aug 1, 2015 6:57pm Aug 1, 2015 6:57pm
  •  pharley
  • Joined Apr 2013 | Status: Member | 594 Posts
Not all work out - If you look at 2 Daily chart above, I was entering in Jan from the second bounce from support - that failed, but I only risk half my normal amount. I also took the third bounce and it went away in my preferred direction. The big gains really outweigh the few losses I might have in getting in to a run.
  • Post #13
  • Quote
  • Edited at 7:18pm Aug 1, 2015 7:04pm | Edited at 7:18pm
  •  pharley
  • Joined Apr 2013 | Status: Member | 594 Posts
Now the boring bit: Been trading for about 8 years. Initially shares/stocks, then CFDs, then forex.

Always used market makers - now I've dumped them and gone to ECN.

Always used to trade 1m, 5m, 15m charts with MACD, stochs, RSI etc. Dumped them and went with price action, no indicators, just SR.

My approach is based on support and resistance being THE most important thing on the charts. Equally as important is risk mgt.

It works for me and may be useful to some others. I know PA traders are probably doing all this stuff already. For me it's a no brainer now - after losing and losing some more, I took about 6 months out of the game to rethink, analyse and learn. Then about 2 years ago I came back to it with this approach and it's working very well.

UK National, Aussie Citizen, now living in Thailand - the freedom is nice!

Don't like waffle or BS. Simpler seems to be better.

Oh happy to answer any questions!

Cheers all.
3
  • Post #14
  • Quote
  • Aug 1, 2015 7:38pm Aug 1, 2015 7:38pm
  •  bloodpoodle
  • Joined Dec 2010 | Status: Member | 537 Posts
Nice system... Keeping it simple.. I see too many on here with 4 or 5 indicators. I love support/resistance myself. good luck!
The only system that will work is one designed by and for yourself.
  • Post #15
  • Quote
  • Aug 1, 2015 7:44pm Aug 1, 2015 7:44pm
  •  pharley
  • Joined Apr 2013 | Status: Member | 594 Posts
Thanks bloodpoodle - that's what I reckon as well! Still, if something works for someone then just master the method whatever it is, plan it and trade it.
  • Post #16
  • Quote
  • Aug 1, 2015 7:52pm Aug 1, 2015 7:52pm
  •  TooSlow
  • Joined Mar 2012 | Status: Trader | 10,262 Posts
Please explain how you arrived at your 100% level. From the charts you posted, I can not deduce how you arrived at that level (177.38).
My Threads Trading is as simple as 1-2-3, Highest Open / Lowest Open Trade
  • Post #17
  • Quote
  • Aug 1, 2015 7:57pm Aug 1, 2015 7:57pm
  •  pharley
  • Joined Apr 2013 | Status: Member | 594 Posts
Hi Tooslow,

If you look at the chart at 2, you can see the last price move from support to resistance to the left of the arrow. That height is what I'm measuring, then taking 90% of it for my target. Chart 3 shows a closer view of it with a modified fib on the chart to measure it. You don't have to use a fib like that - just take top from bottom to get the range in pips and calc 90% of it. If you want to go for 80%, use that figure.

Cheers
  • Post #18
  • Quote
  • Aug 1, 2015 7:58pm Aug 1, 2015 7:58pm
  •  Rtm
  • Joined Jan 2011 | Status: dump and pump | 4,055 Posts
Do you have a trade explorer providing live examples of the trades you take using this system?
All posts are my personal opinion
  • Post #19
  • Quote
  • Aug 1, 2015 8:05pm Aug 1, 2015 8:05pm
  •  pharley
  • Joined Apr 2013 | Status: Member | 594 Posts
Here is another I took more recently on the GBPJPY. I wasn't able to get in front of the charts as much during this run, and only entered 3 times but still managed to get just under 1750 pips (only 2 trades are shown):
Attached Image (click to enlarge)
Click to Enlarge

Name: start of another.PNG
Size: 120 KB
1
  • Post #20
  • Quote
  • Aug 1, 2015 8:08pm Aug 1, 2015 8:08pm
  •  pharley
  • Joined Apr 2013 | Status: Member | 594 Posts
Hi Rtm,

No I've never done a trade explorer thing - not sure what's involved with it. I'll check it out though.

Cheers
Thread Tools Search this Thread
Show Printable Version Show Printable Version
Email This Thread Email This Thread
Search this Thread:

Advanced Search

  • Trading Systems
  • /
  • Support and Resistance Method - Pharley
  • Reply to Thread
    • Page 1 23456 36
    • Page 1 234 36
0 traders viewing now
  • More
Top of Page
  • Facebook
  • Twitter
About FF
  • Mission
  • Products
  • User Guide
  • Media Kit
  • Blog
  • Contact
FF Products
  • Forums
  • Trades
  • Calendar
  • News
  • Market
  • Brokers
  • Trade Explorer
FF Website
  • Homepage
  • Search
  • Members
  • Report a Bug
Follow FF
  • Facebook
  • Twitter

FF Sister Sites:

  • Metals Mine
  • Energy EXCH
  • Crypto Craft

Forex Factory® is a brand of Fair Economy, Inc.

Terms of Service / ©2019