Hi all,
I'm not writing about a specific trading system here but the important stuff that good traders I've talked to seem to know, and often can quote off the top of their heads about the instruments (or groups of instruments) they trade. That's right collecting and tabulating basic characteristics about instruments. So I have don't just have a feel for what an instrument or market is doing at a particular time of day or after a particularly bullish run how far can I expect it retract - I can talk about it probabilistically.
I haven't done this properly before so I thought that I would start thread to help keep track what I'm collecting and how I'm collecting. It would also be really great if some of them or experienced traders in the rooms could help share there thoughts on what is good to know and what isn't.
My other contribution to this will be to automate tallying the data as much as possible.
Some of the thins I want to study include:
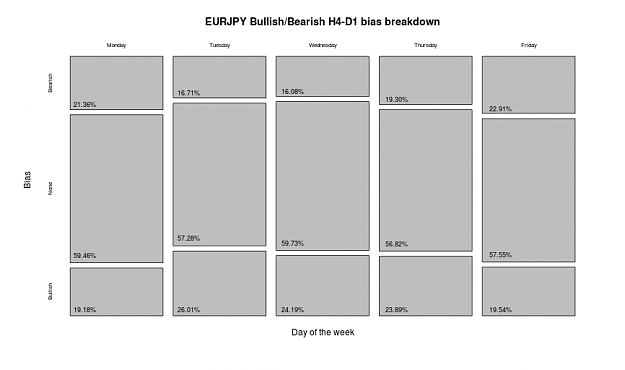
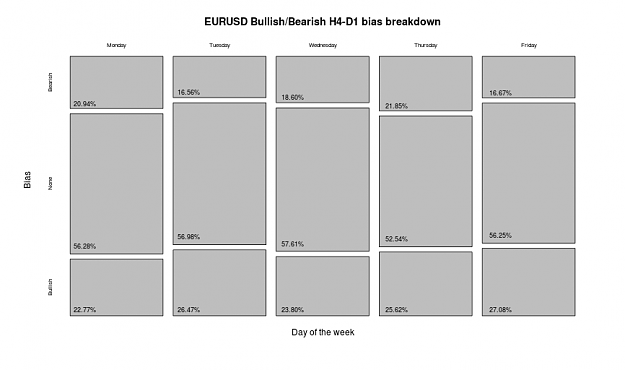
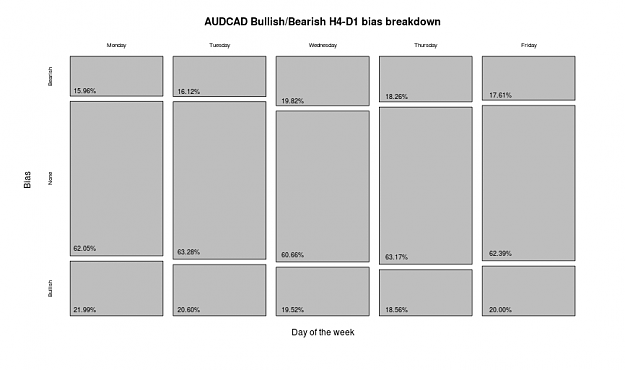
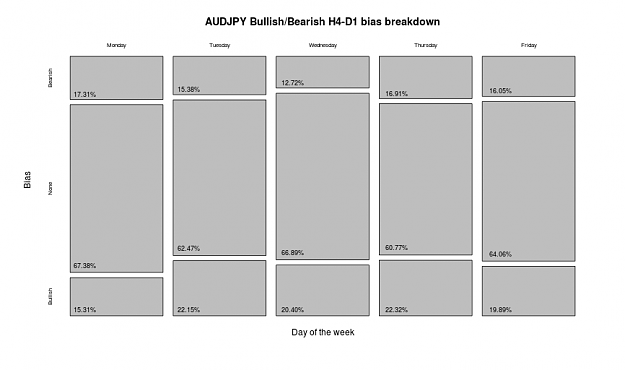
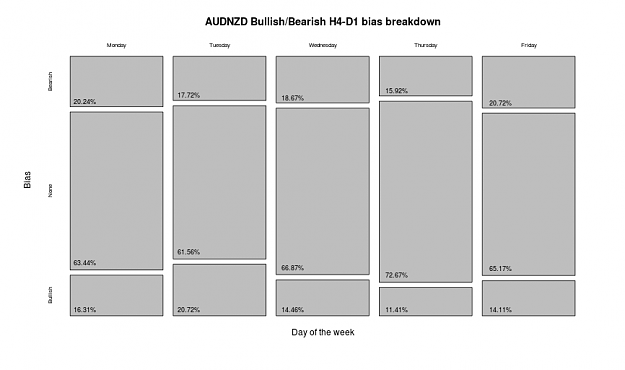
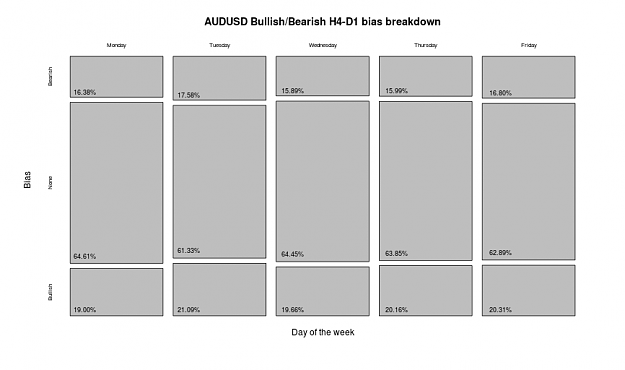
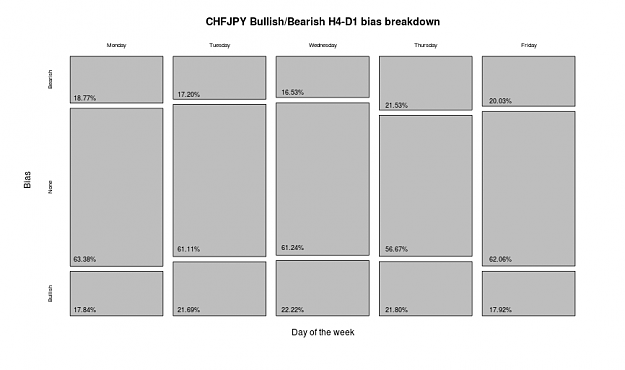
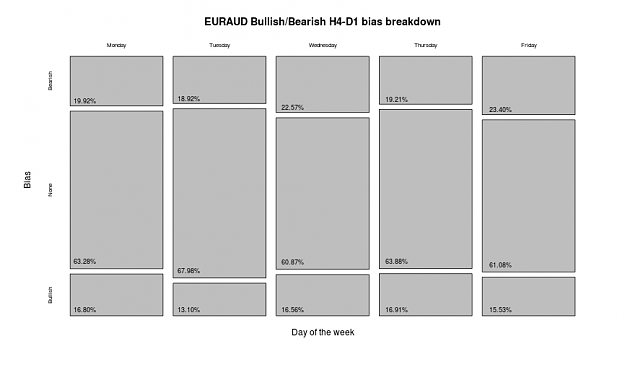
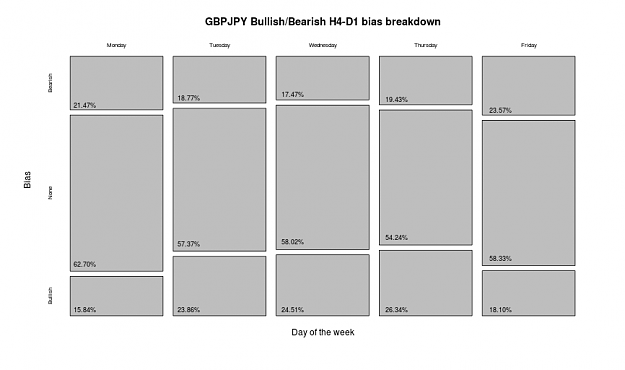
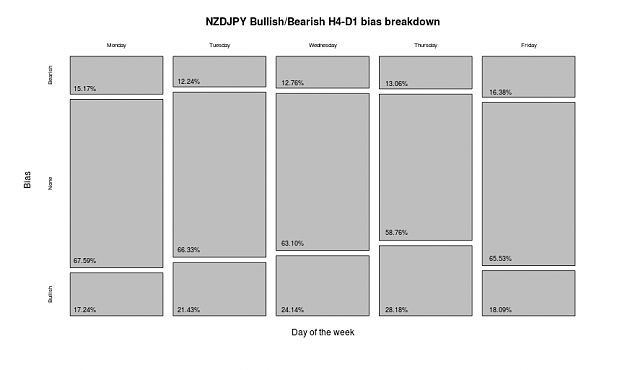
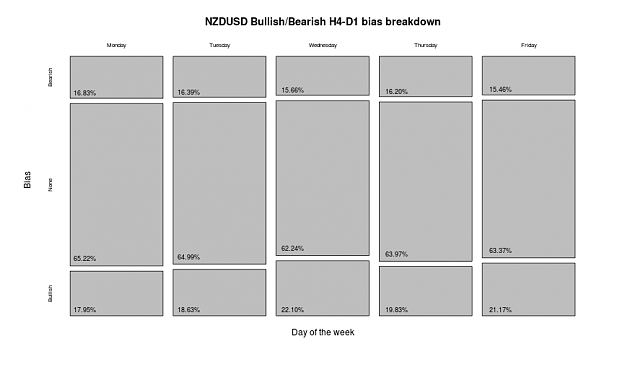
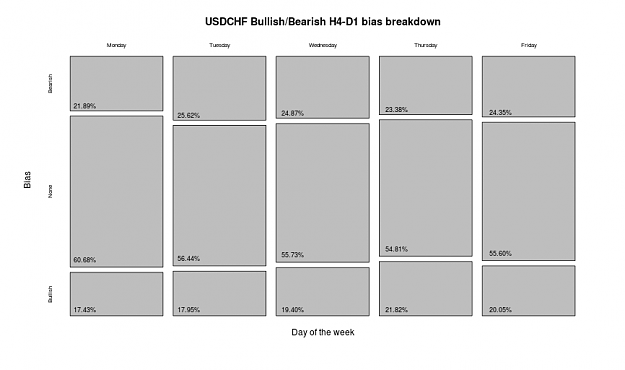
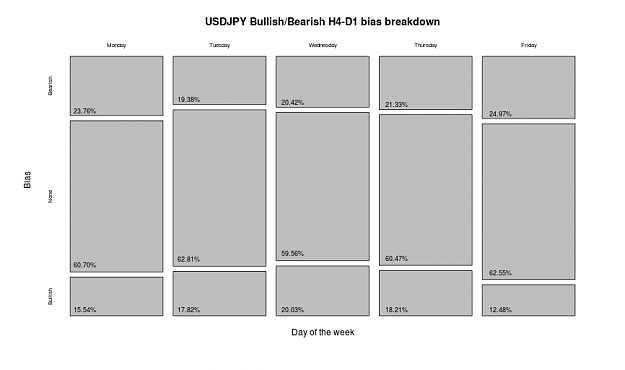
Bar plots show the distribution of days:
The R Code:
I kept the R code simple and easy to read (avoid the apply statements for this cut so any would be R programmers should be able to read it easily) and can be downloaded from here (Has be done this way because FF doesn't like ".R" files ).
).
I'm not writing about a specific trading system here but the important stuff that good traders I've talked to seem to know, and often can quote off the top of their heads about the instruments (or groups of instruments) they trade. That's right collecting and tabulating basic characteristics about instruments. So I have don't just have a feel for what an instrument or market is doing at a particular time of day or after a particularly bullish run how far can I expect it retract - I can talk about it probabilistically.
I haven't done this properly before so I thought that I would start thread to help keep track what I'm collecting and how I'm collecting. It would also be really great if some of them or experienced traders in the rooms could help share there thoughts on what is good to know and what isn't.
My other contribution to this will be to automate tallying the data as much as possible.
Some of the thins I want to study include:
- lengths of rallies and declines on all time frames e.g. how often does the AUDUSD rally 8 days like it did at over the last 2 weeks,
- measure the mean time for Monday gap closures and the distances price goes offside before coming back.
- moves on the open and close of different sessions,
- measure news related volatility,
- annual, monthly, weekly and daily volume,
- price and time
- <insert more/your ideas here>
So get things started here is a simple R script to tally run lengths and the output it produces. I've kept it simple for a first cut and just ran it for daily AUDUSD bars I've exported for an MT4 terminal so that other can reproduce the result with as little effort as possible.
Bars
In total I had 2378 daily bars. See attached data file AUDUSD1440.csv.
R Console output:
A little unformatted and rough will clean it up later e.g. dump output straight to a CSV file.
Inserted Code
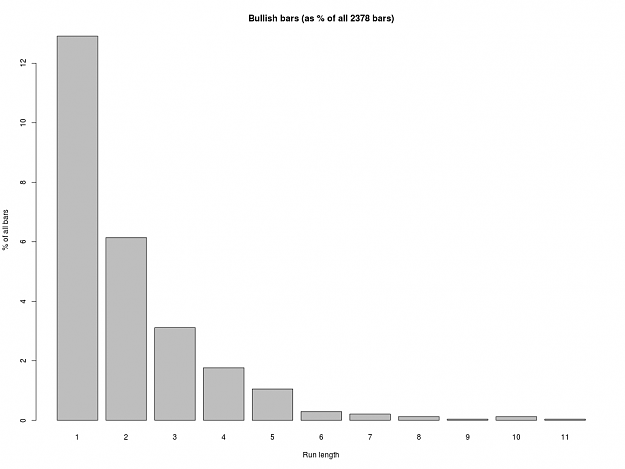
Bullish bars:
Raw numbers:
1 2 3 4 5 6 7 8 9 10 11
307 146 74 42 25 7 5 3 1 3 1
As a proportion (of all 2378 bars):
1 2 3 4 5 6 7 8 9 10 11
0.12910 0.06140 0.03112 0.01766 0.01051 0.00294 0.00210 0.00126 0.00042 0.00126 0.00042
As a proportion (of all 2378 bullish bars):
1 2 3 4 5 6 7 8 9 10 11
0.5000 0.2378 0.1205 0.0684 0.0407 0.0114 0.0081 0.0049 0.0016 0.0049 0.0016
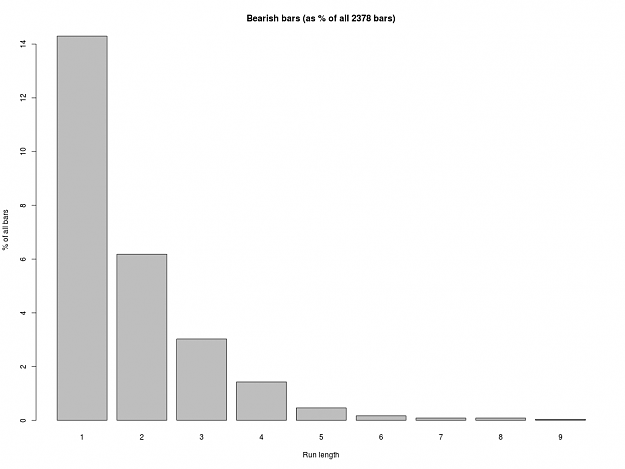
Bearish bars:
Raw numbers:
1 2 3 4 5 6 7 8 9
340 147 72 34 11 4 2 2 1
As a proportion (of all 2378 bars):
1 2 3 4 5 6 7 8 9
0.14298 0.06182 0.03028 0.01430 0.00463 0.00168 0.00084 0.00084 0.00042
As a proportion (of all 2378 bearish bars):
1 2 3 4 5 6 7 8 9
55.46 23.98 11.75 5.55 1.79 0.65 0.33 0.33 0.16
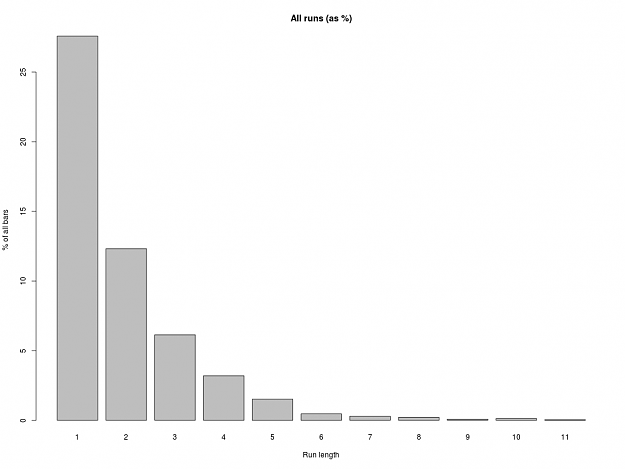
Combined (bull and bear runs):
Raw numbers:
1 2 3 4 5 6 7 8 9 10 11
656 293 146 76 36 11 7 5 2 3 1
As a proportion (of all 2378 bars):
1 2 3 4 5 6 7 8 9 10 11
0.27586 0.12321 0.06140 0.03196 0.01514 0.00463 0.00294 0.00210 0.00084 0.00126 0.00042 Bar plots show the distribution of days:
Attached Image (click to enlarge)
Bearish Runs
Attached Image (click to enlarge)
Bullish Runs
Attached Image (click to enlarge)
Bullish and Bearish Runs
The R Code:
I kept the R code simple and easy to read (avoid the apply statements for this cut so any would be R programmers should be able to read it easily) and can be downloaded from here (Has be done this way because FF doesn't like ".R" files
Inserted Code
UP <- 1
FLAT <- 0
DOWN <- -1

loadMT4Export <- function(filename) {
  data <- read.csv(filename, header=F, stringsAsFactors=F)
  names(data) <- c('date', 'time', 'open', 'high', 'low', 'close', 'volume')
  data$date <- as.Date(data$date,"%Y.%m.%d")
  data
}

runLengthAnalysis <- function(data, pipMultiplier=10000) {
  barUp <- 1
  barFlat <- 0
  barDown <- -1

  barType2Str <- function(bt, period='days') {
    if (bt == barUp) paste("Up", period)
    else if (bt == barFlat) paste("Flat", period)
    else paste("Down", period)
  }

  data <- cbind(data, bar.type=rep(0, nrow(data)))
  data$bar.type[ data$open < data$close  ] <- barUp
  data$bar.type[ data$open == data$close ] <- barFlat
  data$bar.type[ data$open > data$close ] <- barDown

  runs <- rle(data$bar.type)
  dummy.num <- rep(-1, length(runs$lengths))
  dummy.char <- rep(' ', length(runs$lengths))
  result <- data.frame(
    bar.type=dummy.num,
    run.length=dummy.num,
    start.date=dummy.char,
    end.date=dummy.char,
    low=dummy.num,
    high=dummy.num,
    range=dummy.num,
    start.index=dummy.num,
    end.index=dummy.num,
    stringsAsFactors=F
  ;)
  resIndex <- 1

  for (barType in c(barDown, barFlat, barUp)) {
    title <- paste(barType2Str(barType), " bars", sep="")
    for (len in unique(runs$lengths[ runs$value == barType ])) {
      ids <- which(runs$length == len & runs$values == barType)
      for (id in ids) {
        rowIndex <- sum(runs$lengths[1:id])
        x <- as.matrix(data[(rowIndex-len+1):rowIndex, 3:6])
        priceRange <- range(x)
        result$bar.type[resIndex] <- barType
        result$run.length[resIndex] <- len
        result$start.date[resIndex] <- data$date[rowIndex-len+1]
        result$end.date[resIndex] <- data$date[rowIndex]
        result$start.index[resIndex] <- rowIndex-len+1
        result$end.index[resIndex] <- rowIndex
        result$range[resIndex] <- diff(priceRange) * pipMultiplier
        result$low[resIndex] <- priceRange[1]
        result$high[resIndex] <- priceRange[2]
        resIndex <- resIndex + 1
      }
    }
  }

  structure(
    result,
    data=data,
    runs=runs
  ;)
}

## Set output path to where you want to output/save the plots.
outputPath <- '~/tmp/'

## Put in the path to MT4 Bar data CSV file you exported.
data <- loadMT4Export('~/tmp/AUDUSD1440.csv')


result <- runLengthAnalysis(data)
rl <- attr(result, 'runs')
upTable <- table(result$run.length[ result$bar.type == UP])
downTable <- table(result$run.length[ result$bar.type == DOWN])
combinedTable <- table(result$run.length)

symbol <- 'AUDUSD'
period <- 'D1'
w<- 1024
h <- 768
quality <- 300

options(digits=2)
cat("Bullish bars:\n")
png(paste(outputPath, "/", symbol,"_", period, "_", "bullish_runs.png", sep=""), width=w, height=h, units="px")
barplot(100.0*upTable/nrow(data), xlab="Run length", ylab="% of all bars")
title(paste("Bullish bars (as % of all", nrow(data), "bars)"))
dev.off()
cat("Raw numbers:")
print(upTable)
cat("As a proportion (of all", nrow(data), "bars):")
print(upTable/nrow(data))
cat("As a proportion (of all", nrow(data), "bullish bars):")
print(upTable/sum(rl$value == UP))

cat("Bearish bars:\n")
png(paste(outputPath, "/", symbol,"_", period, "_", "bearish_runs.png", sep=""), width=w, height=h, units="px")
barplot(100.0*downTable/nrow(data), xlab="Run length", ylab="% of all bars")
title(paste("Bearish bars (as % of all", nrow(data), "bars)"))
dev.off()
cat("Raw numbers:")
print(downTable)
cat("As a proportion (of all", nrow(data), "bars):")
print(downTable/nrow(data))
cat("As a proportion (of all", nrow(data), "bearish bars):")
print(100.0*downTable/sum(rl$value == DOWN))

cat("Combined (bull and bear runs):\n")
png(paste(outputPath, "/", symbol,"_", period, "_", "combined_runs.png", sep=""), width=w, height=h, units="px")
barplot(100.0*combinedTable/nrow(data), xlab="Run length", ylab="% of all bars")
title(paste("All runs (as %)"))
dev.off()
cat("Raw numbers:")
print(combinedTable)
cat("As a proportion (of all", nrow(data), "bars):")
print(combinedTable/nrow(data))
options(digits=10)
Attached File(s)