by alexmackel
INTRODUCTION
Hello all!
I began this thread in July 15, 2013, to explain my system - AckelSystem - and share my point of view about trading forex.
I am having very good results with this trend following system. Naturally I have much more to improve and learn.
Because I learn everyday, this system can (and will) evolve to reflect my discoveries. I hope the ideas I will share here can be usefull to someone.
GENERAL RECOMMENDATIONS
Use two timeframes, one to filter the trades and a smaller for entries. Stay away of news and the period between end of NY session and opening of Tokyo session. Test this system in a demo account. Forex involves significant risk.
INDICATORS
1) Candles or bars. You can also use Heiken Ashi with common bars above it, so you can have the smooth effect of HA and with bars I can follow the price action signals.
2) Moving averages: SMA 3 close, SMA 3 open, EMA 20 close, EMA 40 close, EMA 110 close, EMA 200 close.
3) MACD 6,13,4 with 3 levels. The MACD must be below the negative level for sells and above the positive level for buys.
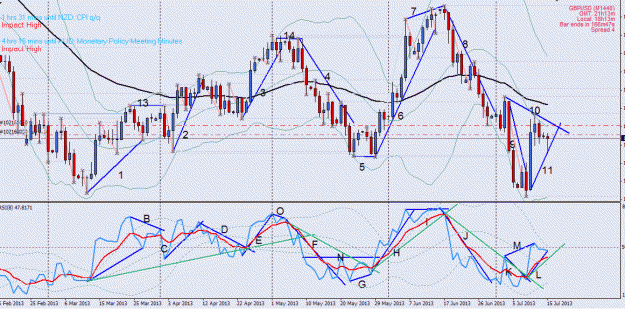
COMMENTED CHART
See the chart above.
1 - EMAs 110 and 200 are the representants of the long term.
2 - EMAs 20 and 40 represents the mid-term.
3 & 4 - SMAs 3 (close and open prices), together with the MACD crossing the signal line, gives the short term perspective. Also the MACD gives the strenght and momentum, indicating the levels and the degree of inclination of its lines.
5 - The AckelSystemArrows indicator (the colored arrows) shows the first time the signal appears.
6 - Another indicator, AckelSystemSignals, shows the entire progress of each signal, with colored bars in a separate window.
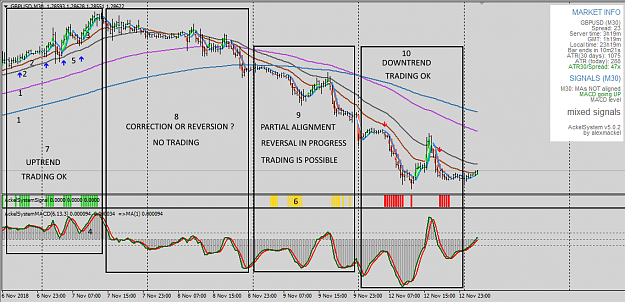
This system was designed for money protection. You can see, in the 4 retangles of this chart, the phases of trading:
- In the 1st phase (7), we are in an uptrend. Low risk trading, but you need get the correct time to enter properly in each trade. The trend is your friend because the impulses are bigger than the corrections.
- In the next phase (8), I dont trade the pair. There are so many others to trade, and this is the most dangerous time to trade. You don't know if the market is in a correction or if it will reverse completely. There is less previsibility. The EMA 20 is under EMA 40 but above EMA 110.
- Trading is possible in the next phase (9). There is a partial alignment, then you can proceed but consider risk less, like 1% of your money, not the regular 2%.
- In the last phase (10), we are in a downtrend, all the EMAs are aligned and we are in our preferred environment again.
HOW IT WORKS
(Bearish examples in trending markets)
1) Be aligned with a higher timeframe (EMA 20 < EMA110 && EMA200).
2) Be at the right side of the market sentment in a given time (Price < EMA 20; MACD < 0).
3) Go with the trend (EMAs aligned and sloping down).
4) Identify opportunities to enter and exit the market (SMAs and MACD crossing in direction of the trend; MACD < Sell level to enter a sell order).
5) Identify the most lucrative opportunities (SMAs near EMA20, MACD near 0, EMA20 near EMA110).
6) Signal: When you have a candle indicating strengh near the SMAs, this is the signal candle. Sometimes I enter selling where a candle or sequence of candles shows rejection to a lvl of resistance above (upper wicks). A trendline breakout (at the end of the correction, resuming the trend) is also a common event here.
7) Trigger: after close of signal candle, the entry candle opens near SMA 3 close and there is a breakout of signal candle.
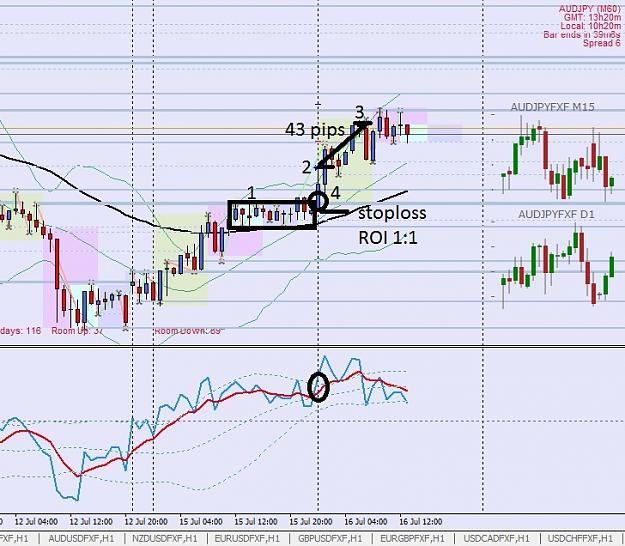
Stoploss can be above the signal candle or above the entry candle. In a M5 chart, normally is from 70 to 100 points (7 to 10 pips). In a M30 chart, something around 200 points (20 pips). But watch the support/resistance levels. Don't put blindly a fixed value of stoploss only because you are accustomed with a "X" value.
ATENTION: This system doesn't work blindly. You have to use your experience to see the results. Knowledge of price action, support and resistance and market structure are essential.
TRADES BASED IN DIVERGENCES
I can trade against the trend when the market is over extended and there is a divergence between prices and MACD, like in posts #257 and #270.
ABOUT MONEY MANAGEMENT AND LOTS
Every trader should limit the total risk of an account, using stoploss in each trade. The general recommendation is risk until 2% of your account each time.
If you have $1000, should risk until $20 each time. I am saying "each time", and not "each trade". So, if you have two opened trades, each of them should represent a risk of 1% or $10.
THEN you have a entry setup. What should be the size of your investment for a $20 risk?
If you entry setup requires a stoploss of 200 points (20 pips), divide $20 by 200 and you have 0.1 lot. If your stoploss should be of 400 points, do $20 / 400 = 0.05 lot.
MY EXCLUSIVE INDICATORS
Attention: The use of these indicators is optional. Please dont ask me for the .mt4 files. The .ex4 files are at the end of this post.
1) AckelSystemPanel - with Market infos, a Signal monitor and a Main Signal alerter. It also plots the high and low of the previous day.
2) AckelSystemSignal - a main signal alerter in a separate window, relative to each bar.
3) AckelSystemArrows - show the entry bar for each trade.
4) AckelSystemMACD - a customized MACD specially configured for this system. Automatically plots the levels for pairs and timeframes.
5) AckelSystemHA - Heiken Ashi customized.
6) AckelSystemSR - show some levels of support and resistance of H1, H4, D1, W1 and MN timeframes.
7) AckelSystemRainbow - show multiple MAs, just to reinforce visually the role of main MAs.
FINAL WORDS
I hope this system can be usefull for you. Please leave your opinion and impressions about this system and ideas about how to improve it.
It is working very well for me, but I am always opened to learn and improve my trading.
I wish you all a lot of success and peace.
WHERE TO GO FROM HERE
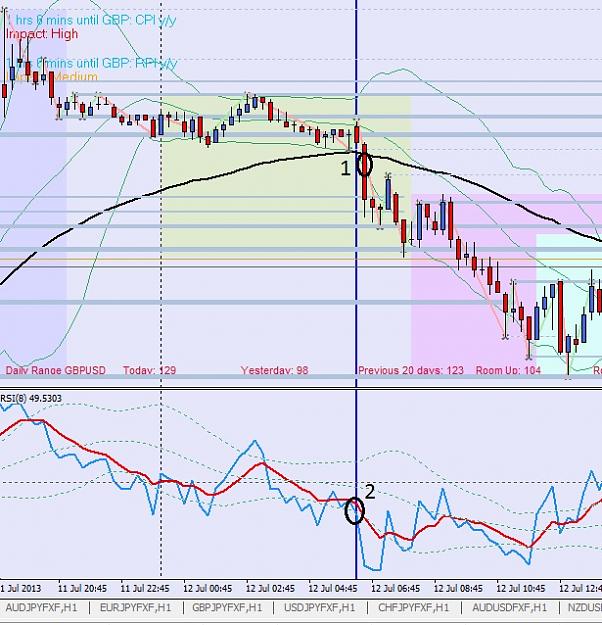
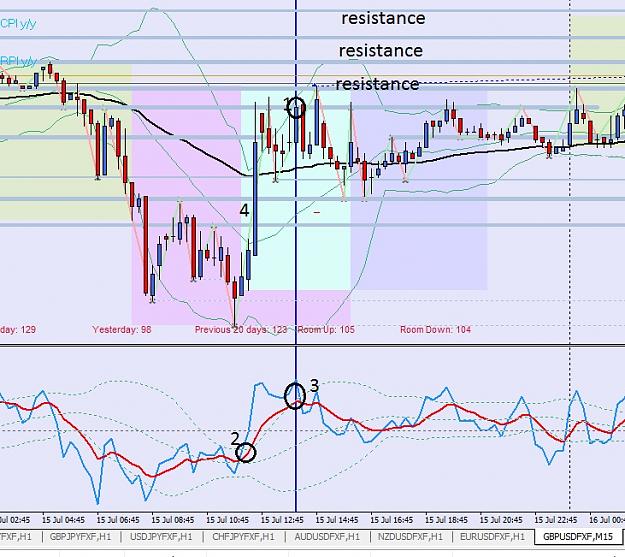
I started this topic (in July 15, 2013) using a system based in Bollinger Bands and EMA50 in the main window and RSI with Bollinger and SMA8 aplied to it in a separate window. I am not using these indicators anymore. As I said from the beginning, the system would evolve, and it did. In Aug 15, 2013 (Post #117) I started adding larger EMAs to give me a broader market perspective, and this gradually became a key aspect of the system. In Dec 7, 2014 (Post#179) I announced the version 4 of this system, when I discarded Bollinger Bands and adopted the MACD instead of the RSI.
Because of these changes, after this initial post you can continue from post #209 . Older posts are an optional reading.
ATTACHMENTS: