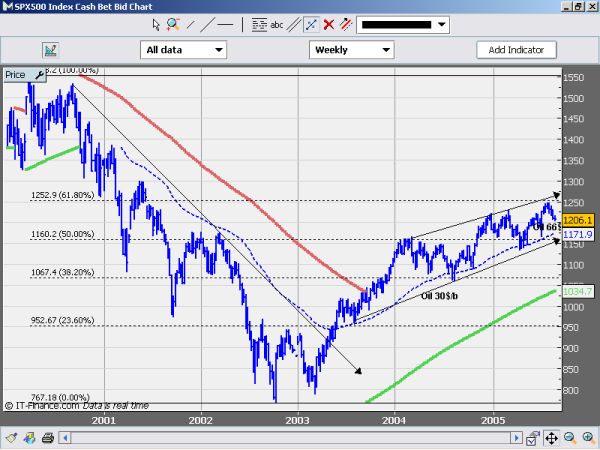
Merlin said recently that the recent hikes in oil prices haven't put the brakes on the US economy. I thought it might be good to check it against the S&P and it looks like he might have a point.
Oil has more than doubled from 30$/barrel from June last year to currently $66. In that time the S&P (Russell would also do) has gone from a low of 1060 (38.2 fib) to nearly 1250 (just under 61.8 fib) - up about 190 points!
But if oil is staying up for the long term, will that eventually slam the breaks?
Or if it is just an oil bubble and bursts dramatically how high could the S&P go!?
Ignored
im not real concerned with oil's impact on the economy. i think oil will hit a high here soon and go back to 40 or 50 a barrell (though i dont have a position YET). i dont think there is anything that can stop the US economy right now. oil prices have barely slowed consumer spending.
the S&P is at a short term low right now, but i think we are due for a change in direction. btw, i just go long S&P futures, part of a mechanical strategy, but i agree with it fundamentally
hey iso, what does your fib analysis say the S&P should go to over the next month? im not good with the waves or anything, but it looks like S&P is in a normal corrective wave (looking at the long term chart you posted).
This is my first post in this forum. I have been reading the discussions for a while, and I thought it would be right to contribute if I am getting something free.
Most forum members seem to be short term or day traders, at least this is my understanding. I am a position trader therefore I am mostly using weekly and daily charts, if not monthly. I am full time trader working from home. I trade forex and futures.
I also would like to post my recommendations where appropriate. You can evaluate them if they are profitable or not.
Thanks for everybody who tries to contribute.
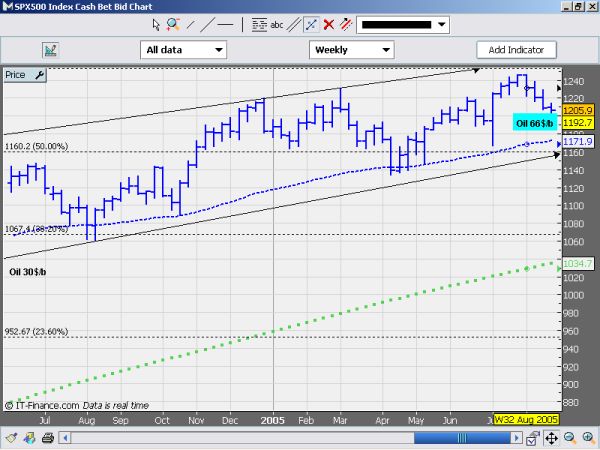
As you can see from weekly SP500 chart, trend is down and major support is around 1176. There is a minor support around 1200, so it is likely that we may see a bounce toward broken support in 1219 but then down again. If you are short, wait 1176 level to take profit.
This is my first post in this forum. I have been reading the discussions for a while, and I thought it would be right to contribute if I am getting something free.
Most forum members seem to be short term or day traders, at least this is my understanding. I am a position trader therefore I am mostly using weekly and daily charts, if not monthly. I am full time trader working from home. I trade forex and futures.
I also would like to post my recommendations where appropriate. You can evaluate them if they are profitable or not.
Thanks for everybody who tries to contribute.
As you can see from weekly SP500 chart, trend is down and major support is around 1176. There is a minor support around 1200, so it is likely that we may see a bounce toward broken support in 1219 but then down again. If you are short, wait 1176 level to take profit.
Ignored
Hi Blackeagle and welcome. Does your position trading imply very large stops? Or have you perfected an entry and a style that allows for smaller stops? Could you share any information on your style of trading? Thanks.
Depend on entry levels. For this Sp500 chart I am using support and resistance lines to enter and exit the position, therefore it doesn't imply large stops. But sometimes, for certain markets, I am using 52 weeks and 104 weeks MA and I am entering long when the price pullbacks to 52 weeks MA and put stoploss under 104 weeks MA. In this case, it implies large stop.
I don't believe small stops protect traders. They are hit frequently due to market volatility and small stoplosses add up big losses. Larger the stop, better the chance of profiting.
Anyone use the "Gap" strategy today? I'm not too informed about this strategy so just passed today.
On the daily chart S&P500 looks like it's in a downtrend. What happens now that the gap is filled. Is it just taken for granted that the trend will now continue down? I see a gap on the Dax too. Can anyone elaborate on this, to clear things a bit more.
hey iso, what does your fib analysis say the S&P should go to over the next month? im not good with the waves or anything, but it looks like S&P is in a normal corrective wave (looking at the long term chart you posted).
Ignored
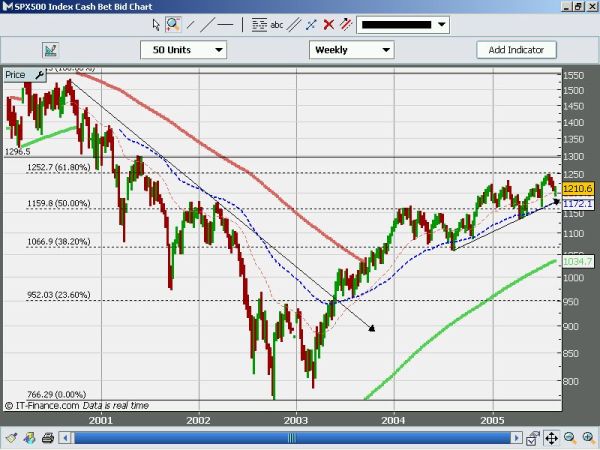
i'm not really an expert in the waves either (should i admit that?) but i do see possible resistance at 1296 once the 62 fib is broken.
i tried playing around with fib fans and arcs but they weren't much help either! the only other thing to do is add on a 79 ret and see where that is...
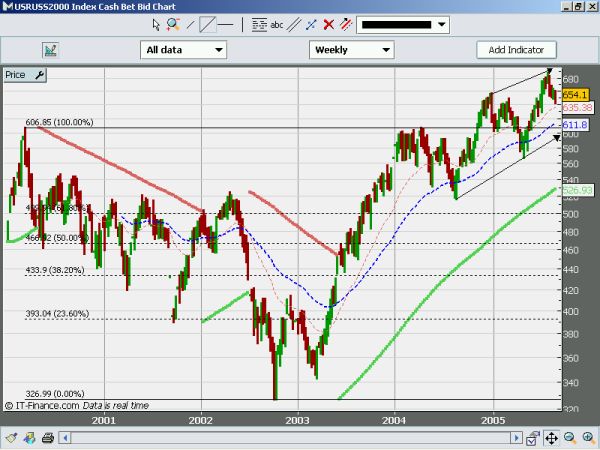
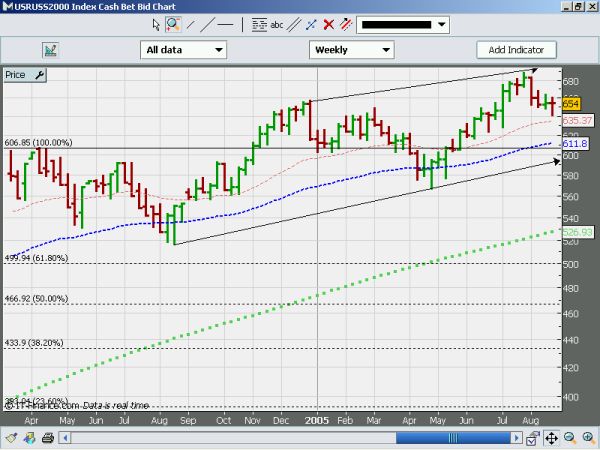
I thought it might be good to compare the S&P against the broadest index, the Russell 2000.
I would expect similar price action, and it does look similar however the Russell seems to be going up stronger.
I wonder because the S&P is four times smaller and perhaps more nimble then is it a leading indicator for the Russell, or does the Russell confirm direction for S&P?
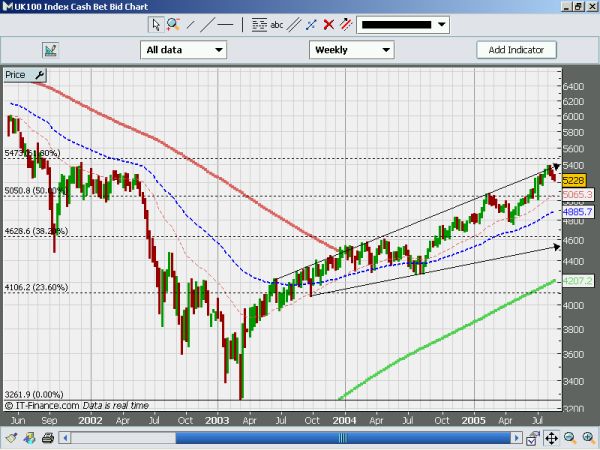
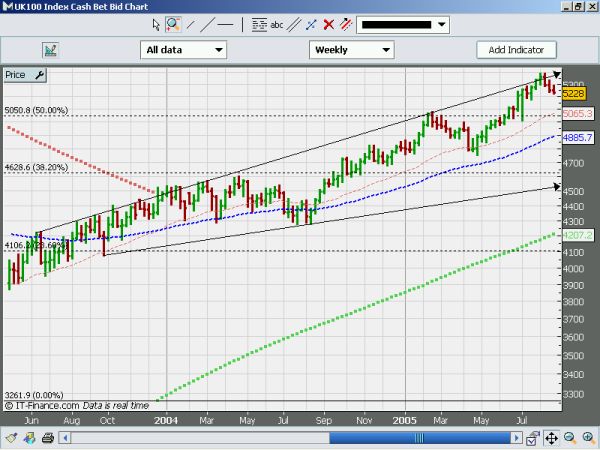
Like S&P, approaching the 62 fib but perhaps a little further back. Similar set up, similar price action.
Its interesting to note that the bear bottom was about 4 months later than the S&P so this implies to me that it is a laggard. But this makes sense since the US economy is the engine room for the world economy, and not the UK!
This is my first post in this forum. I have been reading the discussions for a while, and I thought it would be right to contribute if I am getting something free.
Most forum members seem to be short term or day traders, at least this is my understanding. I am a position trader therefore I am mostly using weekly and daily charts, if not monthly. I am full time trader working from home. I trade forex and futures.
I also would like to post my recommendations where appropriate. You can evaluate them if they are profitable or not.
Thanks for everybody who tries to contribute.
As you can see from weekly SP500 chart, trend is down and major support is around 1176. There is a minor support around 1200, so it is likely that we may see a bounce toward broken support in 1219 but then down again. If you are short, wait 1176 level to take profit.
Ignored
welcome to the forum Blackeagle! we need some position traders around here!
thanks for your insights...
when it goes to 1176 level, do you think we will get a bounce north or do you think it will sit there for a while? i can see it going to 1176 ONLY if it will bounce. i dont see it going there and sitting for any period. i actually think we saw the bottom today at 1195, but we shall see
i'm not really an expert in the waves either (should i admit that?) but i do see possible resistance at 1296 once the 62 fib is broken.
i tried playing around with fib fans and arcs but they weren't much help either! the only other thing to do is add on a 79 ret and see where that is...
Ignored
where are you getting the 1296 resistance from? that peak that the line touches? thats where i was expecting some resistance too
and the bigger question is, do you think we will hit the 66fib before hitting the lower fib lines?
I thought it might be good to compare the S&P against the broadest index, the Russell 2000.
I would expect similar price action, and it does look similar however the Russell seems to be going up stronger.
I wonder because the S&P is four times smaller and perhaps more nimble then is it a leading indicator for the Russell, or does the Russell confirm direction for S&P?
Does anybody know how they are linked?
Ignored
i dont know that the S&P leads the russel2k or vica versa. they pretty much just move together in varying degrees. i trade all of them at the same time because they act pretty much the same. for instance, today i had a duplicate winner on the ES (which i posted graphs for above), EMD (S&P smallcap), NQ, and ER2 (russell2k).
Like S&P, approaching the 62 fib but perhaps a little further back. Similar set up, similar price action.
Its interesting to note that the bear bottom was about 4 months later than the S&P so this implies to me that it is a laggard. But this makes sense since the US economy is the engine room for the world economy, and not the UK!
Ignored
nice observation man!!! this would mean i should go long the UK 100 in a few months
welcome to the forum Blackeagle! we need some position traders around here!
thanks for your insights...
when it goes to 1176 level, do you think we will get a bounce north or do you think it will sit there for a while? i can see it going to 1176 ONLY if it will bounce. i dont see it going there and sitting for any period. i actually think we saw the bottom today at 1195, but we shall see
Ignored
When and if it goes to 1176 level, normally one should expect a bounce targeting 1200 and 1219 levels and stop should be placed under 1176. I don't think it will sit there for any period either. Because I expect a substantial increase in volatility. Also, the period between August and October is seasonally the worst period for stocks. Therefore I expect breakdown of 1176. Yesterday's move can be seen an attempt to test 1219 level. By the way, I can't find 1296 resistance or target either. Trendline resistance of the wedge is around 1265.