Hi Traders,
Let me present you the HDR Breakout system. It is a standard system in which we open a trade when the price breaks out of a trading range. But the difference comes from the way we define that trading range. HDR stands for Hammer-Doji Range.
This system works on any timeframe, but to explain it, we will focus on the 15M timeframe. This will be the timeframe we'll use to open a trade.
So how do we draw that range?
First we look at a timeframe 4 to 6 times bigger than the timeframe we’ll use for trading. As in our case we want to trade on the 15M timeframe, we first open the hourly chart (1H = 4 x 15M) of the currency pair we would like to trade.
What we have to do is look for 3 successive candlesticks having at least one of their shadows greater than their body. As you will notice, if one of the shadows is greater than the body of the candlestick, then that candlestick will look like a Hammer or a Doji.
In addition to that, the first candlestick must not be an inside bar: it should make a higher high or a lower low compared to the previous candlestick. The body of the second candlestick must be completely included inside the whole range (the range from the low to the high) of the first candlestick. And the body of the third candlestick must be completely included in the range of each one of the previous two candlesticks.
Do you understand what those three candlesticks mean? They represent a trading range where there is a lot of indecision in the market. The HDR is a trading range delimited by the indecision in the market at this time, and not by the time the price is moving sideway between the resistance and support areas.
Now that we have our three candlesticks, we take the highest high among the three candlesticks and the lowest low of the three.
Let’s say the highest high is 1.1050 and the lowest low is 1.1020. We have a difference of 30 pips.
The medium level of our trading range will be at 1.1035 ((1.1050 + 1.1020) / 2);
Instead of delimiting the trading range by the highest high and the lowest low, we will actually make the trading range be two times higher (in the case here it will have an height of 60 pips).
Thus the resistance level will be set to 1.1035 + the difference in pips between the highest high and the lowest low (here 30 pips) = 1.1065.
The support level is set to 1.1035 – 30 pips = 1.1005.
Now, above and below our trading range we draw a band with an height equal to one fourth of the height of the trading range (in our case 15 pips).
So we will have the buying band between 1.1065 and 1.1080 and the selling band between 1.1005 and 1.0990.
These two bands will define our buy and sell areas. We enter a long trade as soon as a bullish candlestick closes inside the buy area. And we enter a short trade as soon as a bearish candlestick closes inside the sell area.
We don't enter a long trade if the breakout happends as a tall candlestick crossing the whole buy area and closing above it.
We don't enter a short trade if the breakout happends as a tall candlestick crossing the whole sell area and closing below it.
We don't enter a trade before an major Forex News to be released for the currency we are trading. We also don't trade during a News Release and during the few successive minutes, because a false entry signal is likely to happen. This apply to M30 timeframe or lower. If we are trading on longer timeframe, we don't care about the news.
We also will avoid to trade any breakout occuring outside the London or New York sessions. Often during the Asian session there will be false breakouts.
If a buy was triggered before and the price, after having retraced back towards the trading range, then crosses the buy area forming a tall candlestick, then of course in that case it's all fine for our trade.
The stoploss is set to the other side of the channel + a few pips. And the first profit target is set to have the same number of pips as for the SL, so that we have a 1:1 risk/reward ratio.
When the price reaches the first profit target you can close one half of the trade and let the price go even further (in case it wants to). And it will often do. When you close the first part of the trade you also have to set the SL to breakeven.
That's only an idea and I leave the trade management to you. I only want to show you some location from which a nice move is likely to occure.
Here is an example
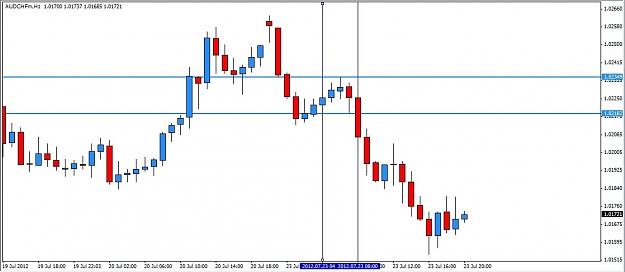
On the 1H timeframe of AUDCHF, in the square delimited by the four lines, we have three Hammer or Doji candlesticks satisfying the conditions above (pic1).
As we can see, the upper line corresponds to the highest high at 1.0235 and the lower line corresponds to the lowest low at 1.0218.
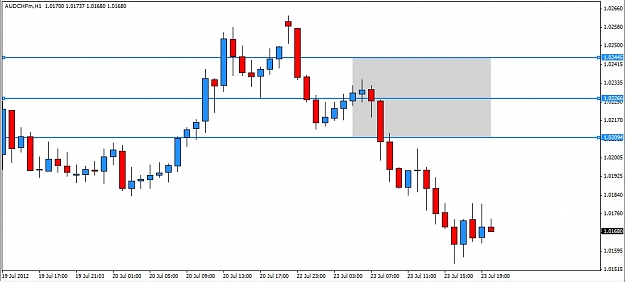
The medium level is 1.02265 and as there is a difference of 17 pips, our channel will have a height of 34 pips with the resistance at 1.02445 and the support at 1.02095. Pic2 shows our trading range.
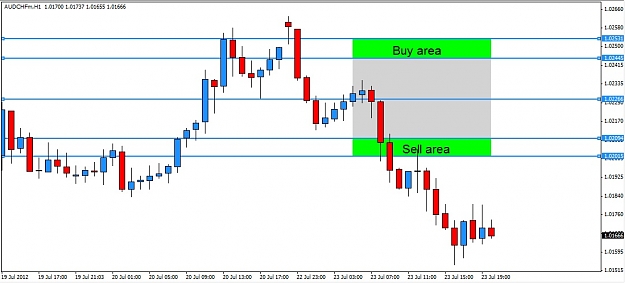
Now we draw the buy and sell area on each side of the trading range (pic3).
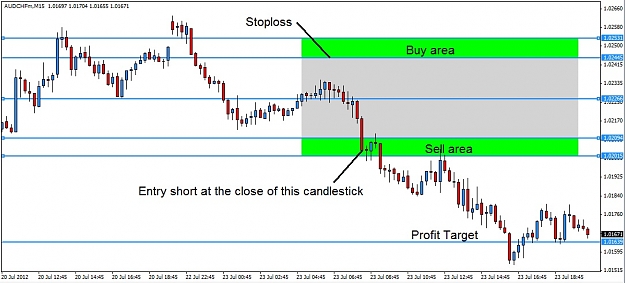
Now we move to the 15M timeframe and we can see on pic4 a short trade opened on the first candlestick closing in the sell area below the channel.
Let me present you the HDR Breakout system. It is a standard system in which we open a trade when the price breaks out of a trading range. But the difference comes from the way we define that trading range. HDR stands for Hammer-Doji Range.
This system works on any timeframe, but to explain it, we will focus on the 15M timeframe. This will be the timeframe we'll use to open a trade.
So how do we draw that range?
First we look at a timeframe 4 to 6 times bigger than the timeframe we’ll use for trading. As in our case we want to trade on the 15M timeframe, we first open the hourly chart (1H = 4 x 15M) of the currency pair we would like to trade.
What we have to do is look for 3 successive candlesticks having at least one of their shadows greater than their body. As you will notice, if one of the shadows is greater than the body of the candlestick, then that candlestick will look like a Hammer or a Doji.
In addition to that, the first candlestick must not be an inside bar: it should make a higher high or a lower low compared to the previous candlestick. The body of the second candlestick must be completely included inside the whole range (the range from the low to the high) of the first candlestick. And the body of the third candlestick must be completely included in the range of each one of the previous two candlesticks.
Do you understand what those three candlesticks mean? They represent a trading range where there is a lot of indecision in the market. The HDR is a trading range delimited by the indecision in the market at this time, and not by the time the price is moving sideway between the resistance and support areas.
Now that we have our three candlesticks, we take the highest high among the three candlesticks and the lowest low of the three.
Let’s say the highest high is 1.1050 and the lowest low is 1.1020. We have a difference of 30 pips.
The medium level of our trading range will be at 1.1035 ((1.1050 + 1.1020) / 2);
Instead of delimiting the trading range by the highest high and the lowest low, we will actually make the trading range be two times higher (in the case here it will have an height of 60 pips).
Thus the resistance level will be set to 1.1035 + the difference in pips between the highest high and the lowest low (here 30 pips) = 1.1065.
The support level is set to 1.1035 – 30 pips = 1.1005.
Now, above and below our trading range we draw a band with an height equal to one fourth of the height of the trading range (in our case 15 pips).
So we will have the buying band between 1.1065 and 1.1080 and the selling band between 1.1005 and 1.0990.
These two bands will define our buy and sell areas. We enter a long trade as soon as a bullish candlestick closes inside the buy area. And we enter a short trade as soon as a bearish candlestick closes inside the sell area.
We don't enter a long trade if the breakout happends as a tall candlestick crossing the whole buy area and closing above it.
We don't enter a short trade if the breakout happends as a tall candlestick crossing the whole sell area and closing below it.
We don't enter a trade before an major Forex News to be released for the currency we are trading. We also don't trade during a News Release and during the few successive minutes, because a false entry signal is likely to happen. This apply to M30 timeframe or lower. If we are trading on longer timeframe, we don't care about the news.
We also will avoid to trade any breakout occuring outside the London or New York sessions. Often during the Asian session there will be false breakouts.
If a buy was triggered before and the price, after having retraced back towards the trading range, then crosses the buy area forming a tall candlestick, then of course in that case it's all fine for our trade.
The stoploss is set to the other side of the channel + a few pips. And the first profit target is set to have the same number of pips as for the SL, so that we have a 1:1 risk/reward ratio.
When the price reaches the first profit target you can close one half of the trade and let the price go even further (in case it wants to). And it will often do. When you close the first part of the trade you also have to set the SL to breakeven.
That's only an idea and I leave the trade management to you. I only want to show you some location from which a nice move is likely to occure.
Here is an example
On the 1H timeframe of AUDCHF, in the square delimited by the four lines, we have three Hammer or Doji candlesticks satisfying the conditions above (pic1).
As we can see, the upper line corresponds to the highest high at 1.0235 and the lower line corresponds to the lowest low at 1.0218.
The medium level is 1.02265 and as there is a difference of 17 pips, our channel will have a height of 34 pips with the resistance at 1.02445 and the support at 1.02095. Pic2 shows our trading range.
Now we draw the buy and sell area on each side of the trading range (pic3).
Now we move to the 15M timeframe and we can see on pic4 a short trade opened on the first candlestick closing in the sell area below the channel.
Attached Image(s) (click to enlarge)