OK so many of you have read the order flow - finding cluster of stops on chart, and that's lovely. But I guess I started off in the wrong direction. It appears to not be on the chart, but behind it.
The order flow thread about finding cluster of stops on A CHART got overextended really, even though it has some MIGHTY good information. What some of the guys have said there takes off plenty of time of the learning curve.
This thread I want to be about what's behind the move. What makes the price inefficient? What does disequlibirum mean and how does it affect prices?
Basically, it is everything that moves the price, but it's not allowed to be showed on a chart. Pure discussion. I want your ideas on equilibrium. Disequlibiurm. Balance. Imbalance. WHAT MAKES PRICE MOVE?
I might shoot one off right now. I don't have a fucking clue why price moves and why sometimes it spikes up and moves down, can it be price inefficiency? Tell me about it. If so, what made that particular participant (let's say..) bid up the price of the currency so high? And why? if it wasn't the real value?
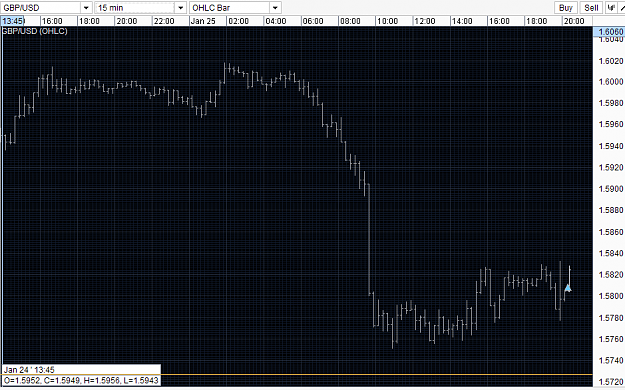
I have noticed sometimes that on the 5/15 min chart we have spikes up in price, from nowhere.. price moves 20-25-30 pips up on one single candle (sometimes more.. but for some reason.. NEVER WITH A RETRACEMENT ) and then the move get's faded 100% and sticks around the same area it moved up from. Then it usually trades in the other direction. I.e. if it moves up and gets faded, it continues to move down.. Why is that do you think? And no, it's not because of RSI.
This thread is about achieving the mindset of an order flow trader. And you are not allowed to post a single chart.
Hopefully this thread will make me THINK about what is happening and draw a conclusion in my mind, and then test my premises on the market.
Take care, and I hope I am not taking to much of your time, whoever you are. But understand that I really want to learn and there are several others who really want to.
The order flow thread about finding cluster of stops on A CHART got overextended really, even though it has some MIGHTY good information. What some of the guys have said there takes off plenty of time of the learning curve.
This thread I want to be about what's behind the move. What makes the price inefficient? What does disequlibirum mean and how does it affect prices?
Basically, it is everything that moves the price, but it's not allowed to be showed on a chart. Pure discussion. I want your ideas on equilibrium. Disequlibiurm. Balance. Imbalance. WHAT MAKES PRICE MOVE?
I might shoot one off right now. I don't have a fucking clue why price moves and why sometimes it spikes up and moves down, can it be price inefficiency? Tell me about it. If so, what made that particular participant (let's say..) bid up the price of the currency so high? And why? if it wasn't the real value?
I have noticed sometimes that on the 5/15 min chart we have spikes up in price, from nowhere.. price moves 20-25-30 pips up on one single candle (sometimes more.. but for some reason.. NEVER WITH A RETRACEMENT
This thread is about achieving the mindset of an order flow trader. And you are not allowed to post a single chart.
Hopefully this thread will make me THINK about what is happening and draw a conclusion in my mind, and then test my premises on the market.
Take care, and I hope I am not taking to much of your time, whoever you are. But understand that I really want to learn and there are several others who really want to.